Responsible Care Results
The latest Responsible Care data by indicators.
Chemical industry’s sustainability program Responsible Care monitors the effects of the program by annually reported data. The participating companies report on multiple indicators that track not just the progress of the program, but also the sustainability measures of the companies themselves.
Climate and Biodiversity Target
Results for 2024
In 2024, 68% of the companies committed to the Responsible Care program had set their own internal climate goal, and 12% were planning to set a goal. Questions about climate-related goals and plans have been included in Responsible Care reporting since 2020. So far, there has been clear progress each year across all areas.
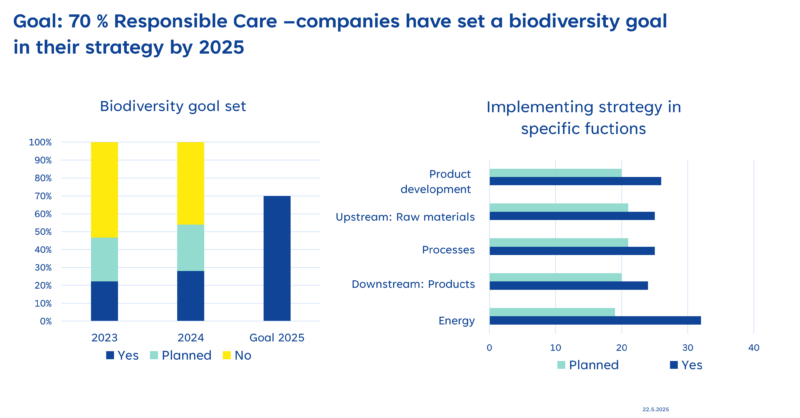
In the 2024 Responsible Care program, 28% of participating companies have set a biodiversity-related goal in their strategy, and 26% are planning to do so.
Climate target
In 2024, 68% of the companies committed to the Responsible Care program had set their own internal climate goal, and 12% were planning to set one. Questions about climate-related goals and plans have been included in Responsible Care reporting since 2020. So far, there has been clear progress each year across all areas.
Definition:
The chemical industry in Finland aims to be carbon neutral by 2045. It is therefore important that companies in the sector set their own intermediate goals and plans to support this goal. In the Responsible Care reporting, companies are asked not only about their climate goals, but also about their plans to reduce greenhouse gas emissions from energy use, production processes, and raw materials.
Differences between companies are highlighted in the different areas of planning. For example, energy use may be the most significant factor for one company, while raw material-related emissions may play a larger role for another.
Results:
In 2024, 68% of the companies had set their own internal climate goal, and 12% were planning to set one. This represents an increase of 2.2 percentage points compared to 2023, and 23 percentage points since the beginning of monitoring in 2020.
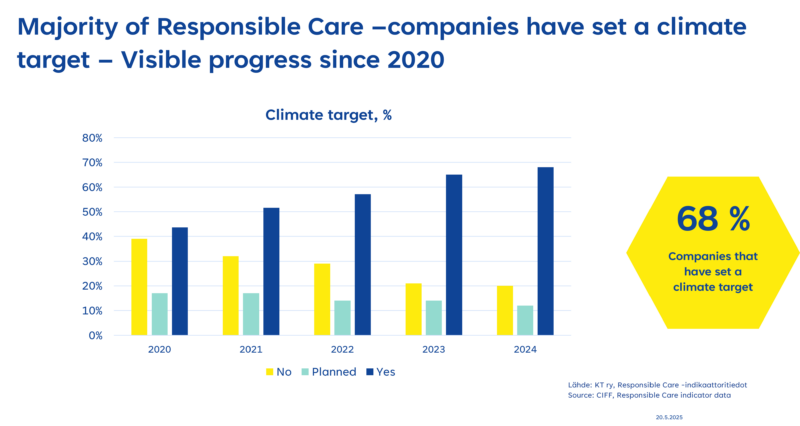
The adoption of climate-related plans has increased relatively steadily each year:
64% of companies (2023: 60%) had prepared a plan to reduce greenhouse gas emissions from energy use, and 13% were preparing a plan.
50% of companies (2023: 47%) had prepared a plan to reduce greenhouse gas emissions from production processes, and 17% were preparing a plan.
43% of companies (2023: 35%) had prepared a plan to reduce greenhouse gas emissions from raw materials, and 20% were preparing a plan.
Biodiversity Goal
In the 2024 Responsible Care program, 28% of participating companies have set a biodiversity-related goal in their strategy, and 26% are planning to do so.
The chemical industry has set a long-term goal of becoming nature-positive, and to support this ambition, a sector-wide roadmap was created in 2022. The roadmap focuses on this decade, acknowledging that just like with climate, nature needs action now. The short-term goal is that by 2025, 70% of companies in the chemical industry will have included a biodiversity-related goal in their strategy.
As a sector, we are actively contributing to international terminology and methodology development (e.g. ISO standardisation), raising awareness through different platforms and sharing best practices among our member companies.
To support progress, we developed a biodiversity indicator in the Responsible Care reporting. It measures the proportion of companies with a biodiversity-related goal in their strategy and the operational areas these goals relate to.
Results:
In 2024, 28% of companies have set a biodiversity goal in their strategy. An additional 26% are planning to do so, while 46% of companies have no goal in place or under consideration yet.
Identified development needs
Challenges have been identified regarding the clarity of terminology and definitions in relation to the biodiversity goal question. In spring 2025, work was launched to clarify the questions and completion guidelines so that the different levels of biodiversity efforts can be better taken into account. The aim is to provide clarity on what can be reported through practical examples and to lower the threshold especially for SMEs to recognize and document actions already taken.
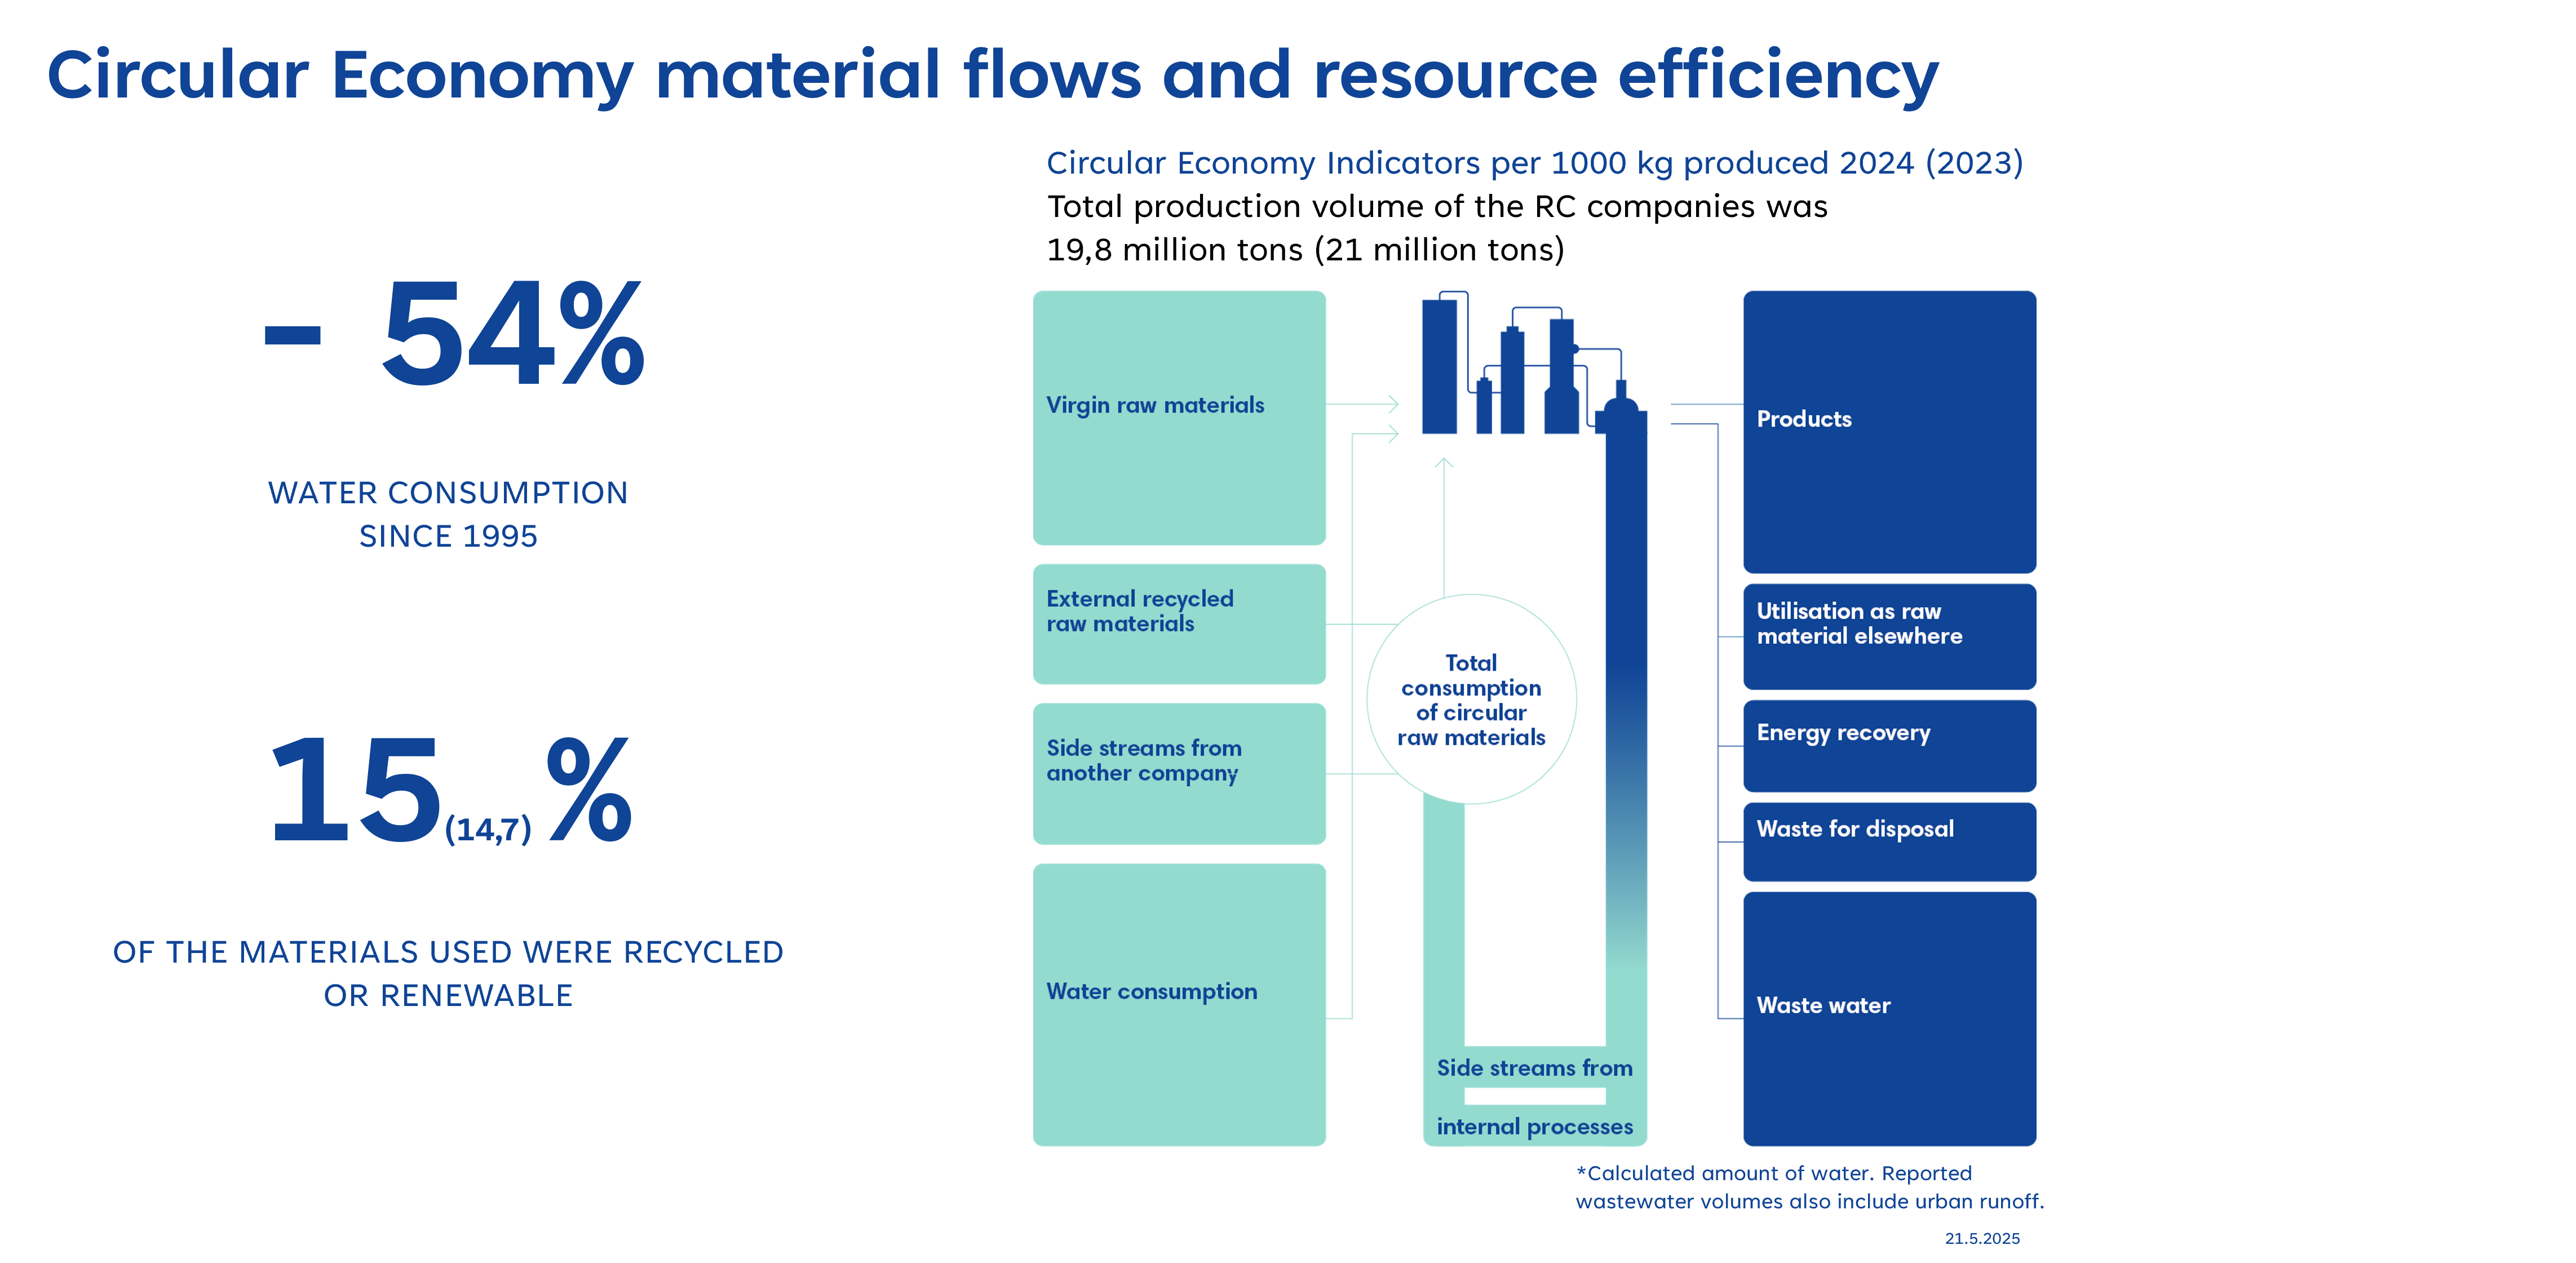
Circular Economy
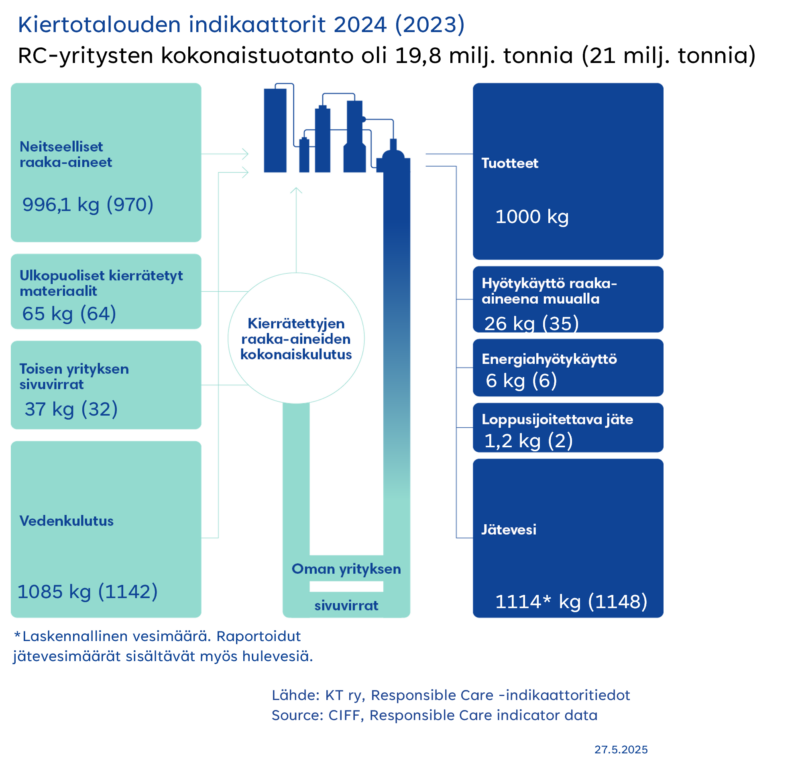
The concept of circular economy holds a central position within the chemical industry, where materials are utilized with high efficiency. The utilized raw materials exhibit as much diversity as the final products, underscoring the industry’s versatility.
The majority of waste generated from production finds its way into beneficial reuse as raw materials elsewhere. Only a small fraction is directed towards energy recovery, and an even smaller portion is destined for ultimate disposal. Molecules are repeatedly repurposed.
Water serves both as a processing medium and as a raw material. Increased attention to water consumption has further augmented resource efficiency.
Results for 2024
In 2024, 54 % of companies reported to use recycled materials or side streams. Roughly 3 % of materials leaving the production are by-products and waste materials. 83 % of these materials were utilized as material elsewhere or in energy recovery.
Personnel and Production Volume of Companies Committed to the Program
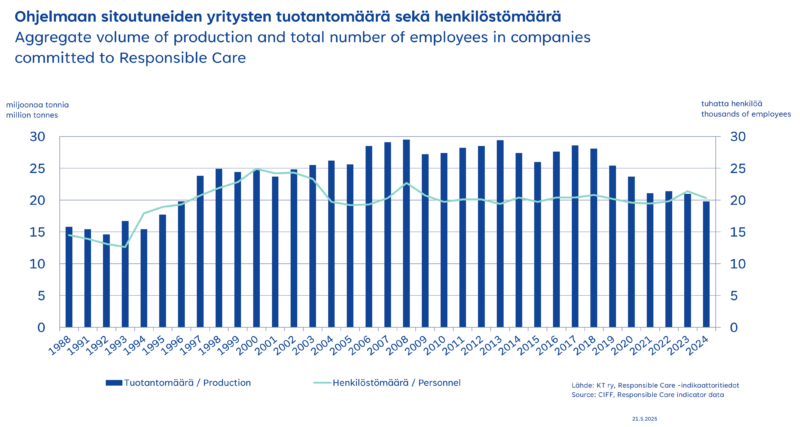
The Responsible Care program covers approximately 80% of the industry’s production in Finland, as well as 60% of personnel in participating companies.
Definition
The extent of the Responsible Care program is expressed as total amount of production and the number of employees in the participating companies in Finland. Some of the indicator information is proportioned to the amount of production or the number of employees.
Results
In 2024, total production of the companies committed to the Responsible Care program amounted to 19,8 million tons and the number of employees to 20 346.
The companies committed to Responsible Care represent 80 % of the production and 60 % of the personnel of the Finnish chemical industry.
The results for 2024 are based on data from 95 companies.
Material Streams in Production
This is a presentation of the overall material streams used in the Responsible Care companies. In 2024, 15 percent of the materials used were renewable or recycled.
Roughly 3 % of materials leaving the production are by-products and waste materials. 83 % of these materials were utilized as material elsewhere or in energy recovery.
The nature of production in the chemical industry varies a lot. In some companies almost all used materials are renewable, while in other companies it is extremely difficult to utilize renewable materials. The proportion of renewable raw materials used in production was 9,5 percent (10 %), and the number of companies reporting to use renewable materials was 38 percent (38 %). In addition to renewable materials, we are following closely the use of recycled materials. 54 percent (55 %) of companies reported to use recycled materials or side streams.
Water is partly used as a raw material in the production of chemical industry products, and some of it binds into products while some of it leaves the production as wastewater.
This material balance showcases the inputs and outputs of materials per 1,000 kg of products. More and more side streams from internal and external companies are utilized.
Energy Consumption
The companies committed to the Responsible Care program have improved their energy efficiency gradually during the past years. In 2024, the total amount of energy consumed was 1.04 kWh per one kg of production. The figure increased 13 percent from 2023, mostly due to changes in reporting methodology and changes in the group of committed companies. Since 1995, energy consumption per total production volume has decreased by 12 percent.
Definition
Energy consumption is reported as consumption of electricity and other energy. Consumption of other energy includes the consumption of fossil fuels such as oil and gas. Companies define the parameters (system boundary) by which they calculate their energy consumption. They also define the extent to which fuels generated within the processes are potentially recovered and utilized as energy. Energy consumption proportional to total production volume signals, among other things, changes in production and processes, as well as the development of energy efficiency.
Results
In 2024, electricity consumption and the consumption of other forms of energy by the companies committed to the Responsible Care program amounted to 4.9 TWh and 15.7 TWh respectively. In proportion to total production, the consumption of electricity and other forms of energy increased by 13 percent from 2023. This increase was mainly due to changes in the reporting method and changes in the group of reporting companies. The figures now represent the most accurate level in the measurement history.
In 2024, a total of 1.04 kWh energy was consumed per one kg of production. As reference, the corresponding figure in 1995 was 1.2 kWh per kilogram of production. Since 1995, energy consumption proportional to total production has decreased by 12 percent.
The majority of consumed electricity is bought from energy suppliers. In 2024, 95 percent of electricity consumed was purchased. Of the other forms of energy consumed, 22 percent was bought energy. In addition to covering their own needs, many companies also sold energy externally.
In 2024, 19 percent of the total energy consumed was produced using renewable energy sources. Of the electricity consumed, 45.5 percent and of other energy, 11.2 percent was produced from renewable sources.
Finland’s total energy consumption in 2024 was approximately 359 TWh, which was 2 percent less than in 2023. The total electricity consumption in Finland was 82.7 TWh, which marked a 3 percent increase compared to the previous year.
*) Source: Statistics Finland
https://pxdata.stat.fi/PXWeb/pxweb/fi/StatFin/StatFin__ehk/?tablelist=true
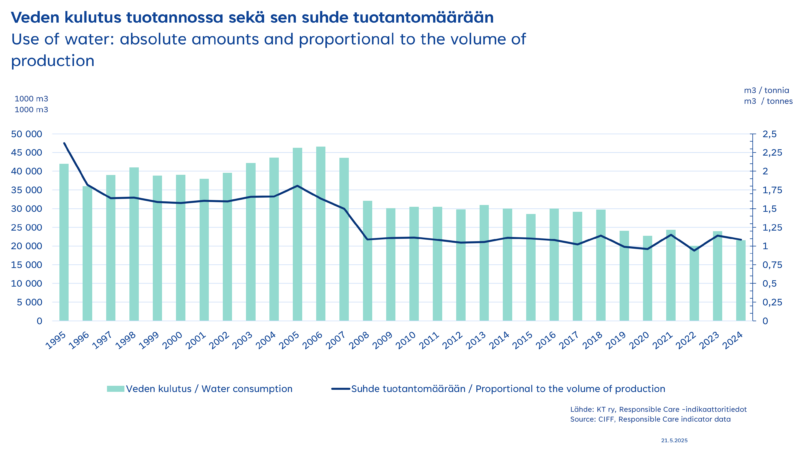
Water Consumption
In 2024, the companies committed to Responsible Care consumed 1.09 litres surface or ground water per one kg of production. Water consumption in production has significantly improved. Consumption per kilogram of production has decreased by 54 percent since 1995.
Definition
The water consumed in production is included in products or is discharged with wastewater for purification. Water consumption compared to total production signals resource efficiency. Water that companies use for cooling purposes is excluded. The water taken in flows in the cooling pipes separate from the materials used in the processes, after which the water is returned back to the sea or lake.
Results
The companies committed to Responsible Care consumed altogether around 21,5 million m3 of water. The use decreased by 4,65%, from 2023.
A total of 1.09 litres of surface or ground water per kg of production was used by companies committed to Responsible Care program In 2024. Part of this water was included in products and part of it was discharged with wastewater for purification. As a reference the corresponding figure in 1995 was 2.4 litres surface or ground water per one kg of production. Water consumption has decreased by 54% since 1995.
90% of consumed water originates from surface water sources and rest is groundwater.
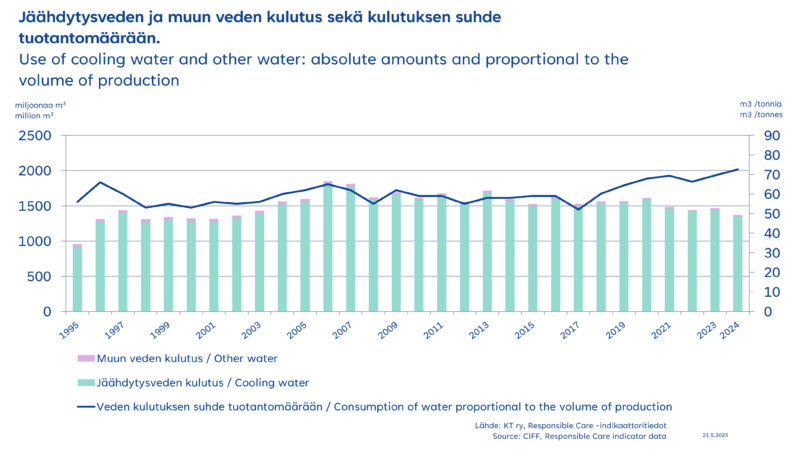
Consumption of Cooling Water and Other Water
Definition
Water consumption is divided into the consumption of cooling water and consumption of water in production. Cooling water is sea- or lake water, taken in for cooling purposes. The water taken flows in the cooling pipes separate from the materials used in the processes, after which the water is returned back to the sea or lake. The water consumed in production is absorbed in the products or exited as wastewater for purification.
Results
IIn 2024, the consumption of cooling water decreased by 6,4 % and water used in production decreased by 4,65 % compared to the previous year.
In the companies committed to the Responsible Care program, cooling water represents about 98 % of total water consumption. Approximately 85 % of cooling water is originated from the sea, rest is from other surface water sources. 90 % of water used in production is originated from surface water sources and rest is consumed from groundwater sources.
In 2024, a total of 1.09 liters surface or ground water per one kg of production was used. Part of this water was included in in the products and part of it was discharged with wastewater for purification. As reference the corresponding figure at 1995 was 2.4 liters surface or ground water per kilogram of production.
Greenhouse Gas Emissions
Greenhouse gas emissions from the chemical industry continue to decline as the sector progresses towards carbon neutrality. The share of Finland’s total greenhouse emissions attributed to the chemical industry is just under 10%.
Within the chemical industry, efforts to reduce the carbon footprint are underway through process innovations and transitioning to the use of low-emission energy sources. The industry’s objective is to achieve carbon neutrality by 2045.
Results for 2024
Total greenhouse gas emissions (direct and indirect) per ton of production have decreased by 32% since 1999. In 2024, the total amount of direct and indirect greenhouse gas emissions by companies committed to the Responsible Care program was approximately 4.46 million tons CO₂e.
Air Emissions
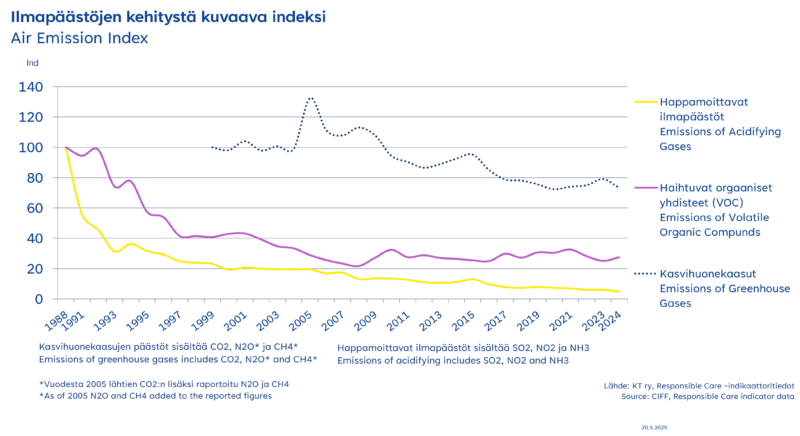
Air Emissions
Air emissions in the chemical industry have steadily decreased. Among the companies participating in the Responsible Care programme, acidifying air emissions have decreased by 95% since 1988, volatile organic compound (VOC) emissions have decreased by 72% since 1988 and direct greenhouse gas emissions per tonne of production have decreased by 27% since 1999
Definition
The air emissions index is calculated by relating emissions to total production. The environmental impact of different types of emissions have been quantified by multiplying the emission with a unique weight factor, which describes the environmental impact of the emission in terms of a reference chemical.
Acidifying emissions, converted to sulphur dioxide equivalents (SO₂):
Sulphur dioxide (SO₂), factor 1
Nitrogen oxides (reported as NO₂, converted to SO₂ with factor 0.41)
Ammonia (reported as NH₃, converted to SO₂ with factor 1.3
Greenhouse gases, converted to carbon dioxide equivalents (CO₂e):
- Carbon dioxide (CO₂), factor 1
- Methane (CH₄), factor 25
- Nitrous oxide (N₂O), factor 298
Volatile organic compounds (VOC) are reported as total tonnes without conversion factors.
The base year for acidifying and VOC emissions is 1988, and for greenhouse gases 1999.
Direct greenhouse gas emissions include those from production processes and on-site energy generation.
Indirect emissions include those arising from the production of purchased electricity and energy.
Results
Among the companies committed to the Responsible Care programme, the index for acidifying emissions has decreased by 95% compared to 1988, the index for VOC emissions has decreased by 72% and direct greenhouse gas emissions per tonne of production have decreased by 27% compared to 1999.
Total greenhouse gas emissions (direct and indirect) per tonne of production have decreased by 32% since 1999
*) Source: VNCI Guideline Environmental Performance Indicators for the Chemical Industry
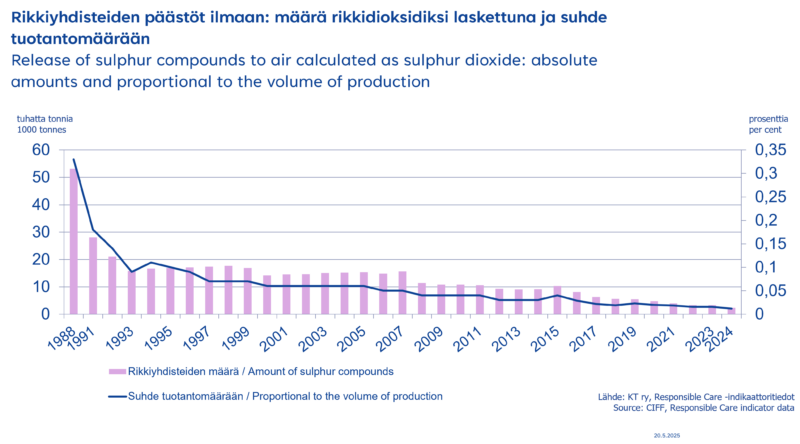
Release of Sulphur Compounds to Air
Definition
Sulphur compound emissions include emissions from on-site power and steam generation and are reported and calculated as Sulphur dioxide (SO2). In the air, Sulphur dioxide contributes to environmental acidification, which in turn damages vegetation and causes corrosion damages.
Results
In 2024, Sulphur dioxide emissions by the companies committed to the Responsible Care program totaled some 2 340 tons, down 29 % from 2023. Proportional to total production volume, Sulphur dioxide emissions dropped 24 % from 2023 levels. Since 1988, Sulphur dioxide emissions to air have decreased by more than 96%.
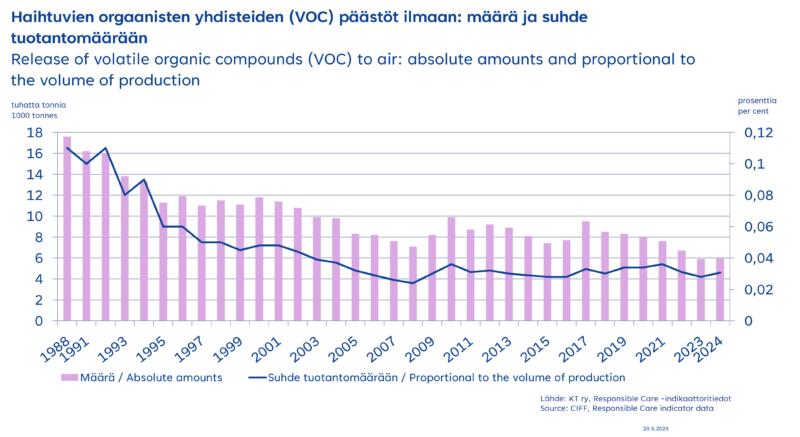
Release of Volatile Organic Compounds (VOC) to Air
Definition
Volatile organic compounds (VOC) are organic compounds with a vapor pressure of at least 0.01 kPa at 20°C or having a corresponding volatility under particular conditions of use. The amount is reported as a sum of different hydrocarbons. VOCs increase the formation of ozone in the lowest layers of the atmosphere. Increased ozone concentrations contribute to respiratory diseases and affect vegetation.
Results
In 2024, VOC emissions by the companies committed to the Responsible Care program totaled some 6 080 tons, increased about 3,5 % from 2023. Proportional to total production volume, VOC emissions amounted to some 0.03 %. Since 1988, VOC emissions proportionated to total production volume have decreased by about 72 %.
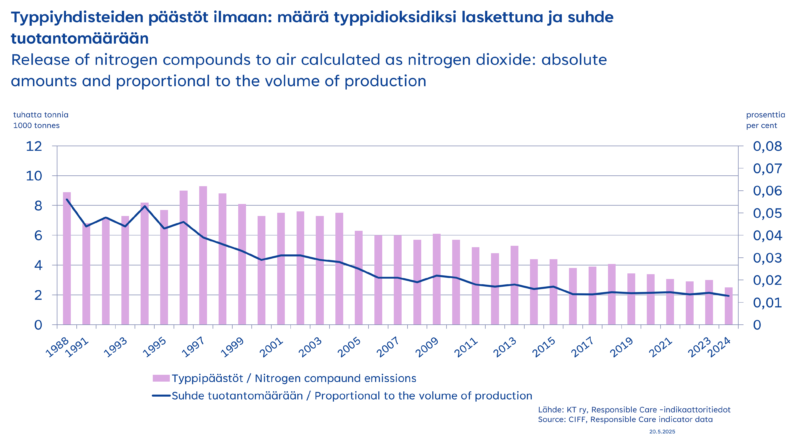
Release of Nitrogen Compounds to Air
Definition
Nitrogen compound emissions to air include emissions from on-site power and steam generation and are reported and calculated as nitrogen dioxide (NO2). In the air, nitrogen dioxide contributes to environmental acidification and increases eutrophication of water bodies.
Results
In 2024, nitrogen compound emissions by the companies committed to the Responsible Care program totaled some 2,5 tons, 15 % less than previous year. Proportional to the volume of production, nitrogen compound emissions decreased by 10 %, compared to the previous year. The nitrogen compound emissions in proportion to the volume of production have decreased by 77 % since 1988.
Discharges to Water
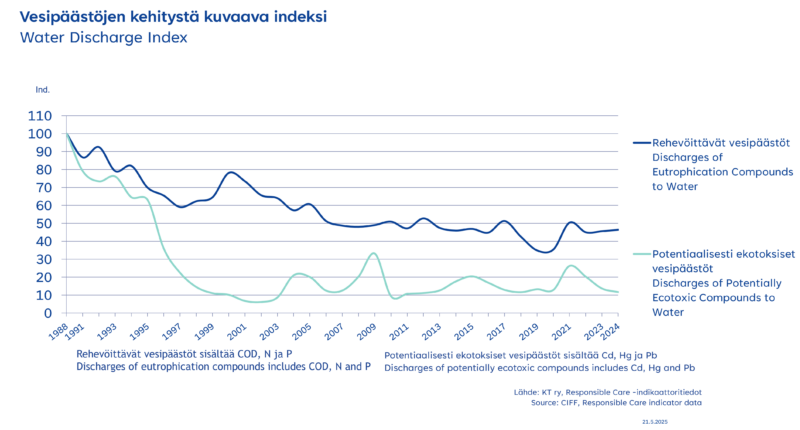
Discharges to Water
Discharges to water in chemical industry decreased significantly during 1990s. Reduction in water discharges with eutrophication potential has been 54% and in potentially ecotoxic water discharges 86%.
Definition
The water discharge index includes water discharges with eutrophication potential and potentially ecotoxic water discharges, both proportionated to the volume of production. The base year of the index is 1988. The environmental impact of different types of emissions have been quantified by multiplying the emission with a unique weight factor, which describes the environmental impact of the emission in terms of a reference chemical.
Discharges with eutrophication potential include discharges of phosphorus (changed to PO4 by multiplying with a unique weight factor of 3.06), nitrogen (changed to PO4 by multiplying with a unique weight factor of 0.42) and COD (Chemical Oxygen Demand) (changed to PO4 by multiplying with a unique weight factor of 0.022).
Potentially ecotoxic discharges include the discharges of mercury (changed to 1,4-Dichlorobenzene with a unique weight factor of 316.97), cadmium (changed to 1,4-Dichlorobenzene with a unique weight factor of 289.43) and lead (changed to 1,4-Dichlorobenzene with a unique weight factor of 2.4). *)
Results
Since 1988, the companies committed to the Responsible Care programme have succeeded in reducing their water discharges with eutrophication potential by 51%. In 2024 the water discharges with eutrophication potential increased by approximately 1,6 % compared to 2023.
At their present level, discharges with eutrophication potential by the chemical industry are not significant as a whole in Finnish terms. The companies’ discharge reduction efforts have been beneficial throughout the review period, and in general the trend is downwards.
Similar and even more effective progress has been made in reducing potentially ecotoxic water discharges, which have decreased by 81% since 1988. In 2024 the amount of ecotoxic water discharges decreased by 14,5 % compared to the previous year.
*) Source: VNCI Guideline Environmental Performance Indicators for the Chemical Industry
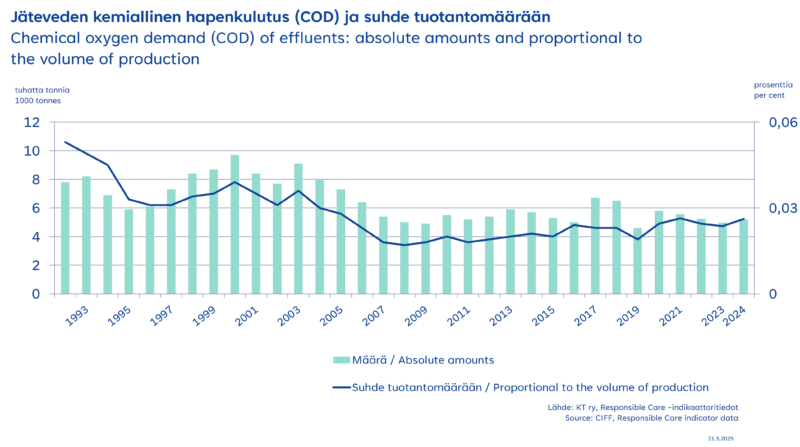
Chemical Oxygen Demand
Definition
The chemical oxygen demand (COD) is the amount of oxygen required to degrade the organic compounds of wastewater. The higher the COD concentration of wastewater, the more oxygen the discharges demand from water bodies.
In the Responsible Care program, wastewater effluents by the chemical industry have been measured and calculated from the wastewater led from plants directly to receiving waters or to community sewerage systems. This enables monitoring the impact on effluents by the companies’ own measures and the results being unaffected by the performance of municipal sewage treatment plants. Waste waters going through the sewerage system are treated by community wastewater treatment plants before being discharged into receiving waters, thereby substantially reducing the impact on water bodies.
Results
Responsible Care -ohjelmassa mukana olevien yritysten jätevesien kemiallinen hapenkulutus oli vuonna 2024 noin 5 194 tonnia, mikä merkitsi noin 4 % nousua edelliseen vuoteen verrattuna. Tuotantomäärään suhteutettuna kemiallisen hapenkulutuksen arvo kasvoi noin 11 %. Vuodesta 1992 jätevesien kemiallinen hapenkulutus suhteutettuna tuotantomäärään on vähentynyt 51 %.
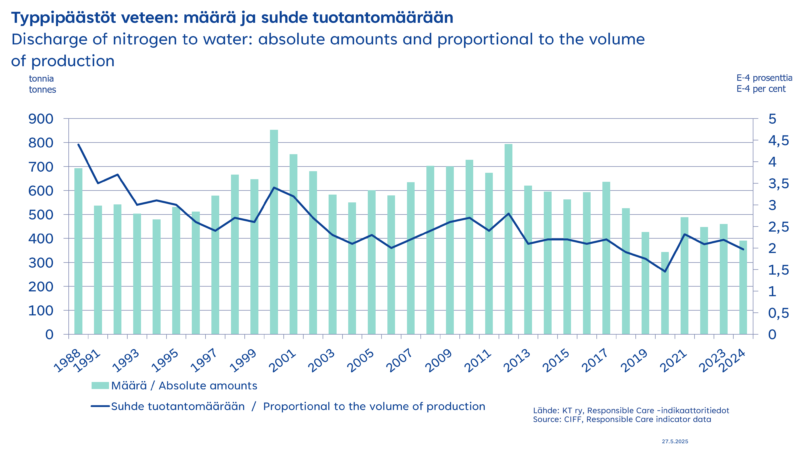
Discharge of Nitrogen to Water
Definition
Discharges of nitrogen compounds are measured as elemental nitrogen (N). Discharges of nitrogen compounds show in increased eutrophication and turbidness of waters and in algal growth.
In the Responsible Care programme, wastewater effluents by the chemical industry have been measured and calculated from the wastewater led from the plants directly to receiving waters or to community sewerage systems. This enables monitoring impact on effluents by the companies’ own measures and the results being unaffected by the performance of municipal sewage treatment plants. Waste waters going through the sewerage system are treated by community wastewater treatment plants before being discharged into receiving waters, thereby substantially reducing the impact on water bodies.
Results
In 2024, total nitrogen discharges by the companies committed to the Responsible Care program amounted to around 391 tons, which was decreased by around 25 % from 2023. In proportion to total production volume, nitrogen discharges have decreased by about 9,7 % since 2023. Since 1988 the nitrogen discharges in proportion to the volume of production have decreased by 55 %.
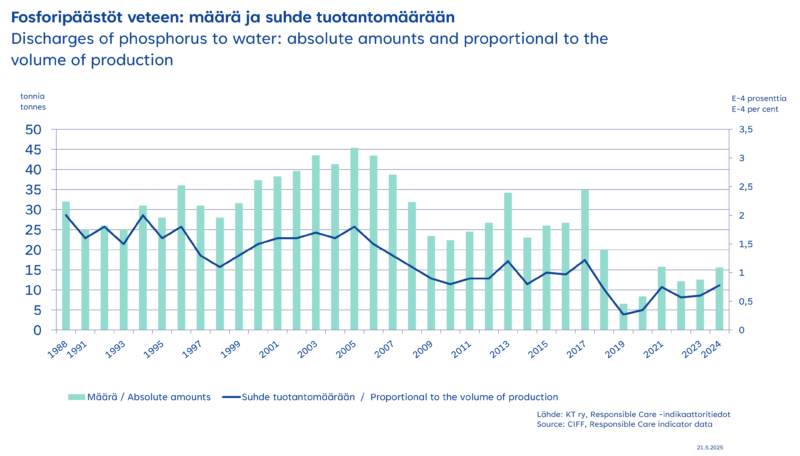
Discharge of Phosphorus to Water
Definition
Discharges of phosphorus compounds are measured and calculated as elemental phosphorus (P). Discharges of phosphorus compounds show in increased eutrophication and turbidness of waters as well as in algal growth.
In the Responsible Care program, wastewater effluents by the chemical industry have been measured and calculated from the wastewater led from plants directly to receiving waters or to community sewerage systems. This enables monitoring the impact on effluents by the companies’ own measures and the results being unaffected by the performance of municipal sewage treatment plants. Waste waters going through the sewerage system are treated by community wastewater treatment plants before being discharged into receiving waters, thereby substantially reducing the impact on water bodies.
Results
In 2024, phosphorus discharges by the companies committed to the Responsible Care program totaled 15,6 tons, which increased 24 % from 2023. In proportion to the volume of production, phosphorus discharges increased 32 % from 2023. Since 1988 phosphorus discharges in proportion to the volume of production have decreased by 61 %.
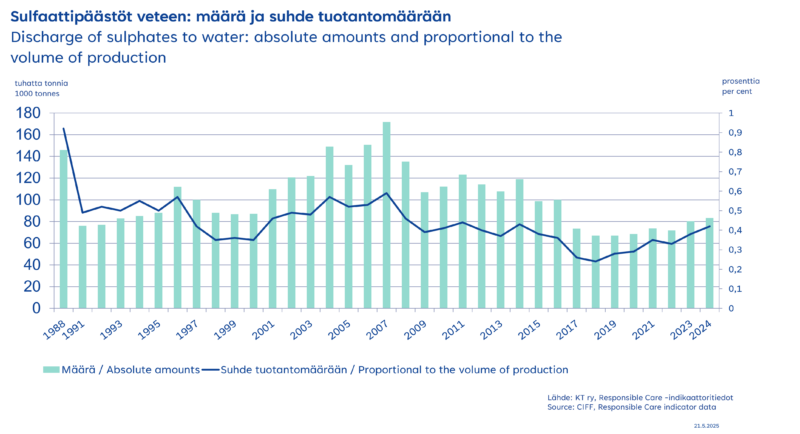
Discharge of Sulphates to Water
Definition
Discharges of sulphur compounds are measured and calculated as sulphate (SO42-), because most of the sulphur compounds ending up in water bodies are explicitly sulphates. High sulphate concentrations can damage the fish population and other aquatic organisms.
In the Responsible Care programme, wastewater effluents by the chemical industry have been measured and calculated from the wastewater led from plants directly to receiving waters or to community sewerage systems. This enables monitoring the impact on effluents by the companies’ own measures and the results being unaffected by the performance of municipal sewage treatment plants. Waste waters going through the sewerage system are treated by community wastewater treatment plants before being discharged into receiving waters, thereby substantially reducing the impact on water bodies.
Results
In 2024, sulphate discharges to water by the companies committed to the Responsible Care program totaled about 83 370 tonnes, which increased 4 % from 2023. Since 1988, the amount of sulphate discharges in proportion to the volume of production has decreased by about 54%.
Safety
The continuous development of safety and well-being has yielded significant results in the chemical industry over the long term. The objective is a continuous improvement towards achieving zero incidents.
Since 2000, the number of accidents leading to absences has decreased to a fifth. The accident rate within the chemical industry is notably lower than the industrial average in Finland. The increasing number of safety observations and recorded near-miss incidents also reflects an active safety mindset.
Results for 2024
In the year 2024, a negative downturn in safety figures can be seen. Among companies, 40 % reported no injuries resulting in absences for their own personnel. Additionally, 27 % of companies reported no injuries of any kind. The total recordable injury freqency (TRFI) has increased by 10 % since 2023.
Near miss reporting and safety observations resulted in 68 504 (63 176 previous year) reports in total. This means 3,4 reports or observations per person. In 2024 there were 3 safety observations made per person.
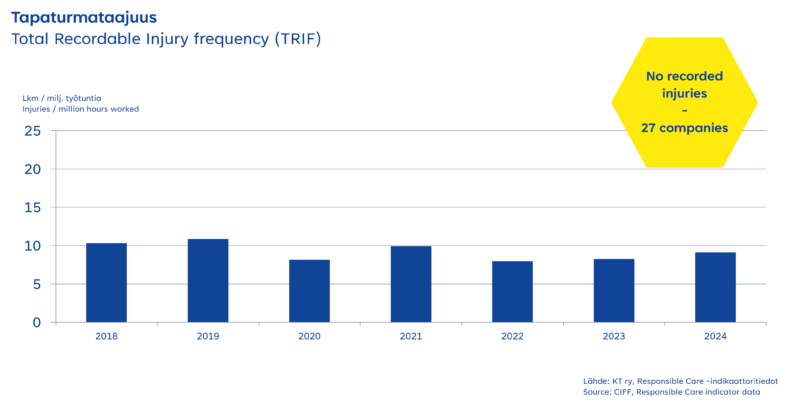
Total Recordable Injury frequency (TRIF)
Definition
Injury is an occupational injury which requires medical treatment. Not included are sick leaves, fatalities or accidents occurred when commuting between home and work. The frequency rate is expressed as the number of injuries per million working hours. Employee refers to all company employees excluding the personnel of outside contractors.
Total Recordable Injury Frequency (TRIF)
In 2024, a total of 9,13 injuries per million hours worked (TRIF) occurred in the companies committed to the Responsible Care programme. Lost time injuries frequency rate increased by 10 % since 2024.
27 companies reported zero injuries in 2024.
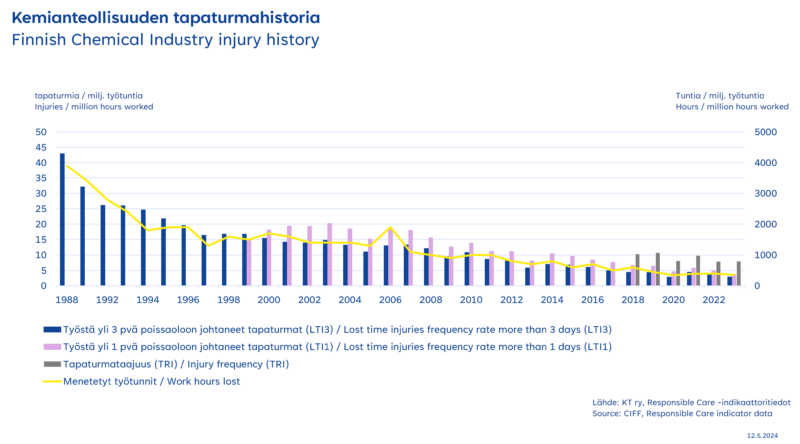
Finnish Chemical Industry Injury History
Focusing on occupational safety has produced long-term results in the chemical industry. The increase in the number of accidents in the 2024 results is an important reminder of the importance of maintaining a strong safety culture.
The results
Companies participating in the Responsible Care program had 3,26 LTI3 accidents per million work hours in 2024. The number of lost work hours was 466 per million work hours. The frequency of LTI3 accidents increased by 6% from the previous year. In 2023 the frequency was 3.07 LTI3 accidents per million working hours. Since the comparison year of 1988, the LTI3 frequency has decreased by 92 %.
The number of lost working hours increased by 30% compared to the previous year.
There were 4,25 accidents causing at least one day of absence per million working hours (LTI1). This indicator increased by 30 % from 2023.
There were no lost time injuries for personnel in 40 % of the companies
Only the company’s own workforce is taken into account, not outside contractors.
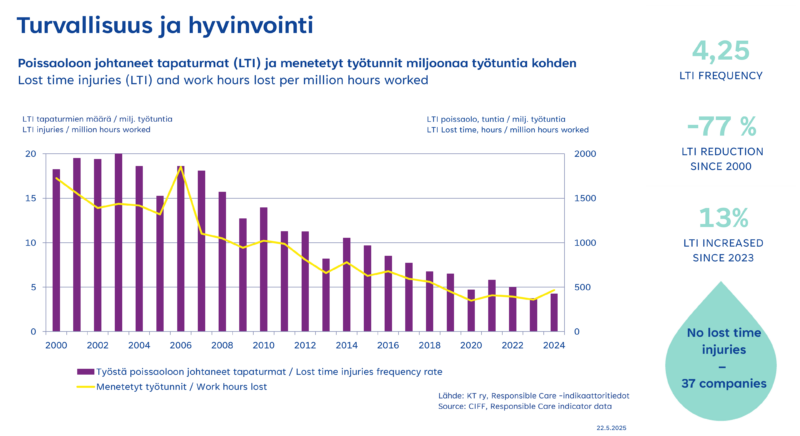
Lost Time Injuries (LTI) and Work Hours Lost per Million Hours Worked
Definition
Lost time injury (LTI) is an occupational injury to an employee resulting in at least one day absence from work in addition to the day of accident. Not included are sick leaves, fatalities or accidents occurred when commuting between home and work. The frequency rate is expressed as the number of injuries per million working hours. Employee refers to all company employees excluding the personnel of outside contractors.
Results
In 2024, a total of 4,25 lost time injuries per million hours worked (LTI1) occurred in the companies committed to the Responsible Care program. Lost time injuries frequency (LTIF) increased by 13 % since 2023.
Since 2000 the lost time injuries have decreased 77 %.
40 % of the companies committed to the Responsible Care program reported zero lost time injuries for employees.
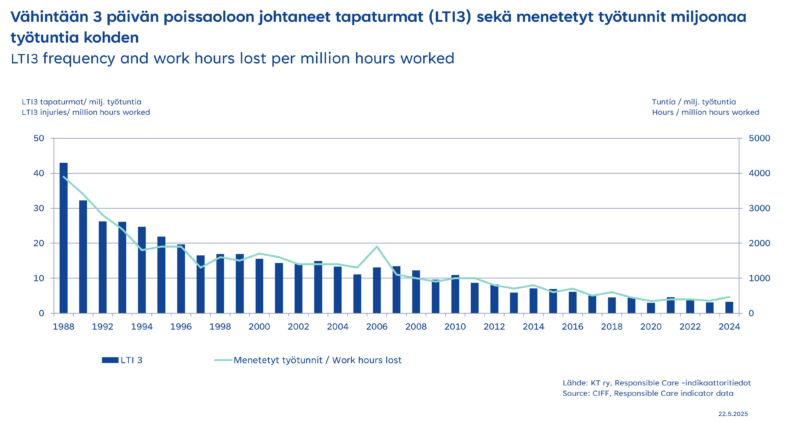
LTI3 Frequency
The continuous improvement of health and safety issues has produced results in the chemical industry. In 2024, a total of 3.26 lost time injuries per million man-hours worked (LTI3) occurred in the companies committed to the Responsible Care program. Lost time injuries frequency rate increased by 6 % from 2023. Since 1988 LTI3 injuries have decreased by 92 %.
Definition
LTI3 Lost time injury is an occupational injury to an employee resulting in at least three days’ absence from work in addition to the day of accident. Not included are sick leaves, fatalities or accidents occurred when commuting between home and work. The frequency is expressed as the number of injuries per million working hours. Employee refers to all company employees excluding the personnel of outside contractors.
Work hours lost refer to the amount of work hours lost due to injuries defined above, not including those due to fatalities or invalidity. Lost time injury frequency rate measures the level of occupational safety of a company and forecasts the likelihood of occurrence of actual process accidents. The number of work hours lost gives an indication of the severity of injuries.
Results
In 2024, a total of 3,26 lost time injuries per million hours worked (LTI3) occurred in the companies committed to the Responsible Care program. The number of work hours lost was 466 hours per million hours worked. LTI3 frequency has increased by 6 % from 2023 when the total was 3,07 lost time injuries per million hours worked. Since 1988 LTI3 frequency has reduced by 92 %.
The number of work hours lost per million hours worked increased 30% compared to the previous year.
Injury to an employee resulting in at least one day’s absence from work is a more sensitive indicator. The progress with this indicator has been similar to LTI3. In 2024, a total of 4,25 LTI1 injuries per million hours worked occurred in the companies committed to the Responsible Care program. LTI1 increased by 13 % from 2023.
40 % of the companies committed to the Responsible Care programme reported zero lost time injuries for employees.
Only the company’s own personnel, not contractors, have been taken into account in the figures.

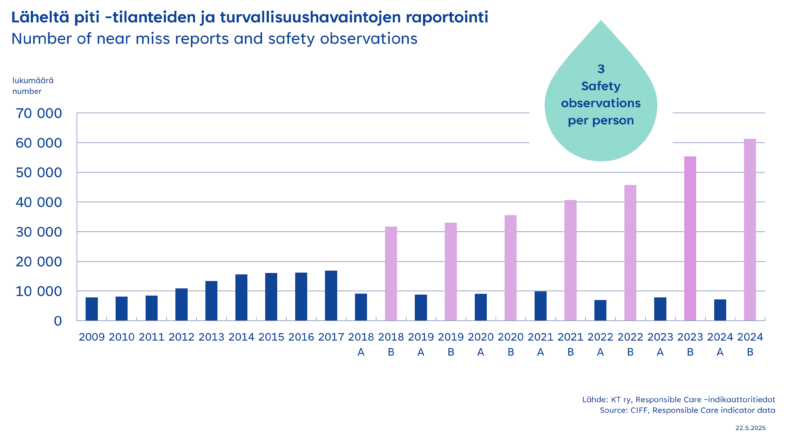
Near Miss Reporting and Safety Observations
Definition
Near miss reporting and safety observations reporting was developed in 2018. Companies were asked for separate reporting on both near miss situations as well as general safety observations. Since 2018, a more comprehensive picture was seen on the development in the safety culture with a preventive approach.
Near miss reporting
Near miss reporting is a system which collects and evaluates data on potentially hazardous injuries and damages. Corrective actions are evaluated and implemented based on near miss reporting. Near miss reporting is an effective way of preventing injuries and damages.
Safety observations
Number of reported safety observations. Safety observations are observations in lack of physical environment or ways of doing, that might increase the risk for a work safety or process safety incident. Reported observations can also be positive observations for good conduct in physical environments or ways of doing.
Results
Near miss reporting and safety observations resulted in 68 504 (63 176 previous year) reports in total. This means 3,4 reports or observations per person.
In 2024 there were 3 safety observations made per person.
97% of companies reported a total of 7 205 near miss reports and 61 299 safety observations in 2024.
Personnel and Production Volume of Companies Committed to the Program
The Responsible Care program covers approximately 80% of the industry’s production in Finland, as well as 60% of personnel in participating companies.
Definition
The extent of the Responsible Care program is expressed as total amount of production and the number of employees in the participating companies in Finland. Some of the indicator information is proportioned to the amount of production or the number of employees.
Results
In 2024, total production of the companies committed to the Responsible Care program amounted to 19,8 million tons and the number of employees to 20 346.
The companies committed to Responsible Care represent 80 % of the production and 60 % of the personnel of the Finnish chemical industry.
The results for 2024 are based on data from 95 companies.
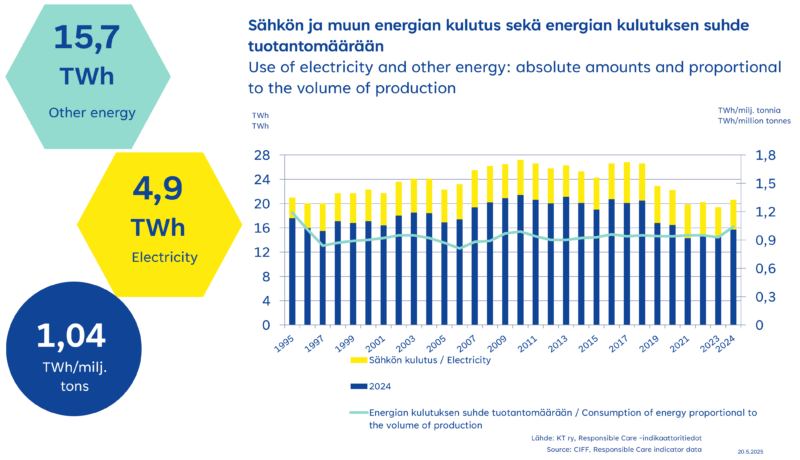
Energy Consumption
Companies committed to the Responsible Care program have systematically improved their energy efficiency over the years, with several also signing the national energy efficiency agreement.
Many processes in the chemical industry require high pressure and elevated temperatures, resulting in a significant overall energy consumption. While a majority of the consumed energy is purchased from energy providers, a portion of it is also self-generated.
Results for 2024
Since 1995, energy consumption proportional to total production has decreased by 12 %. In 2024, 19 % of the total energy consumed was produced using renewable energy sources. In 2024, 24 % of the total consumed energy was electricity, while the remainder was other forms of energy, such as heat. Of the electricity consumed, 45.5 % and of other energy, 11.2 % was produced from renewable sources.
Climate Target
In 2024, 68% of the companies committed to the Responsible Care programme had set their own internal climate target, and 12% were planning to set a target. Questions about climate-related targets and plans have been included in Responsible Care reporting since 2020. So far, there has been clear progress each year across all areas.
Definition:
The chemical industry in Finland aims to be carbon neutral by 2045. It is therefore important that companies in the sector set their own intermediate targets and plans to support this goal. In the Responsible Care reporting, companies are asked not only about their climate targets, but also about their plans to reduce greenhouse gas emissions from energy use, production processes, and raw materials.
Differences between companies are highlighted in the different areas of planning. For example, energy use may be the most significant factor for one company, while raw material-related emissions may play a larger role for another.
Results:
In 2024, 68% of the companies had set their own internal climate target, and 12% were planning to set one. This represents an increase of 2.2 percentage points compared to 2023, and 23 percentage points since the beginning of monitoring in 2020.
Results by topic
The adoption of climate-related plans has increased relatively steadily each year:
64% of companies (2023: 60%) had prepared a plan to reduce greenhouse gas emissions from energy use, and 13% were preparing a plan.
50% of companies (2023: 47%) had prepared a plan to reduce greenhouse gas emissions from production processes, and 17% were preparing a plan.
43% of companies (2023: 35%) had prepared a plan to reduce greenhouse gas emissions from raw materials, and 20% were preparing a plan.

Energy Consumption
The companies committed to the Responsible Care program have improved their energy efficiency gradually during the past years. In 2024, the total amount of energy consumed was 1.04 kWh per one kg of production. The figure increased 13 percent from 2023, mostly due to changes in reporting methodology and changes in the group of committed companies. Since 1995, energy consumption per total production volume has decreased by 12 percent.
Definition
Energy consumption is reported as consumption of electricity and other energy. Consumption of other energy includes the consumption of fossil fuels such as oil and gas. Companies define the parameters (system boundary) by which they calculate their energy consumption. They also define the extent to which fuels generated within the processes are potentially recovered and utilized as energy. Energy consumption proportional to total production volume signals, among other things, changes in production and processes, as well as the development of energy efficiency.
Results
In 2024, electricity consumption and the consumption of other forms of energy by the companies committed to the Responsible Care program amounted to 4.9 TWh and 15.7 TWh respectively. In proportion to total production, the consumption of electricity and other forms of energy increased by 13 percent from 2023. This increase was mainly due to changes in the reporting method and changes in the group of reporting companies. The figures now represent the most accurate level in the measurement history.
In 2024, a total of 1.04 kWh energy was consumed per one kg of production. As reference, the corresponding figure in 1995 was 1.2 kWh per kilogram of production. Since 1995, energy consumption proportional to total production has decreased by 12 percent.
The majority of consumed electricity is bought from energy suppliers. In 2024, 95 percent of electricity consumed was purchased. Of the other forms of energy consumed, 22 percent was bought energy. In addition to covering their own needs, many companies also sold energy externally.
In 2024, 19 percent of the total energy consumed was produced using renewable energy sources. Of the electricity consumed, 45.5 percent and of other energy, 11.2 percent was produced from renewable sources.
Finland’s total energy consumption in 2024 was approximately 359 TWh, which was 2 percent less than in 2023. The total electricity consumption in Finland was 82.7 TWh, which marked a 3 percent increase compared to the previous year. *)
*) Source: Statistics Finland
https://pxdata.stat.fi/PXWeb/pxweb/fi/StatFin/StatFin__ehk/?tablelist=true
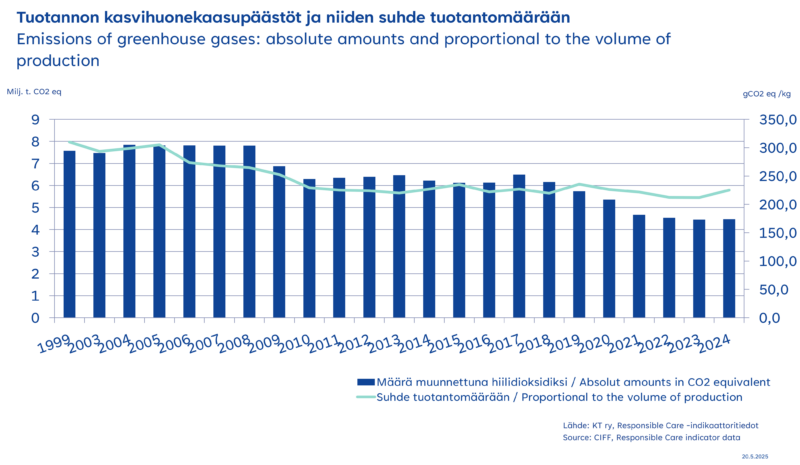
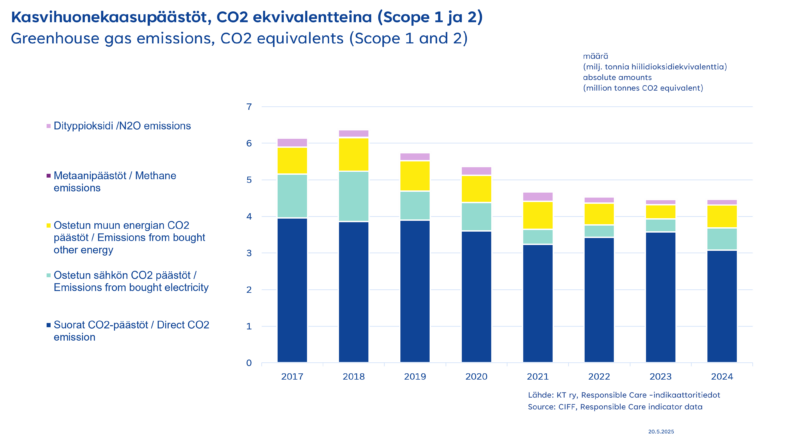
Greenhouse Gases
In 2024, greenhouse gas intensity of production by companies committed to the Responsible Care programme was approximately 225 gCO₂e per one kg of production. In 1999, the corresponding figure was 310 gCO₂e. Greenhouse gas emissions proportional to production volume have decreased by 27 percent during the monitoring period.
Definition
Emissions of greenhouse gases include not only actual direct process emissions, but also emissions from on-site power and steam generation. Additionally, indirect emissions from the production of purchased electricity and energy are included.
Greenhouse gases contribute to global warming, and their reduction is a key global objective.
Greenhouse gases other than carbon dioxide include methane (CH₄), nitrous oxide (N₂O), and fluorinated gases (HFCs). In the calculations, methane and nitrous oxide emissions have been converted into carbon dioxide equivalents (CO₂e) using the following global warming potentials: CH₄: 25 and N₂O: 298
Results
In 2024, the total amount of direct and indirect greenhouse gas emissions by companies committed to the Responsible Care programme was approximately 4.46 million tonnes CO₂e, representing an increase of 0.3% compared to 2023. However, when compared to the volume of production, emissions increased by 6.5%. This increase was mainly caused by changes in the reporting methodology and changes in the companies committed to the programme. The 2024 figures represent the most accurate level in the measurement history.
Approximately 72% of total emissions originated from direct emissions, while 28% came from indirect emissions from purchased energy.
In 2024, 43% of purchased energy came from renewable sources. When nuclear energy is included, the share of zero-emission indirect energy rises to 62% of the total.
Direct carbon dioxide emissions were approximately 3.2 million tonnes in 2024, down 11% from the 3.6 million tonnes reported in 2023.
Emissions of other greenhouse gases (CH₄ and N₂O) totaled approximately 580 tonnes in 2024 (2023: 557 tonnes), of which: Methane (CH₄): 62 tonnes and Nitrous oxide (N₂O): 518 tonnes
When converted to CO₂ equivalents, the combined total of these non-CO₂ greenhouse gas emissions was approximately 0.16 million tonnes CO₂e, which marks a 4% increase from 2023.
The greenhouse gas intensity figure of 225 gCO₂e/kg in 2024 includes: Direct emissions from processes and on-site energy production, and Indirect fossil emissions from purchased energy. In 1999, the equivalent figure was 310 gCO₂e/kg of production.
By far the largest share of Finland’s national greenhouse gas emissions originate from carbon dioxide emissions in the energy sector. In 2023, Finland’s total greenhouse gas emissions were approximately 53.1 million tonnes CO₂-equivalent. *)
*) Source: Statistics Finland – Finland’s Greenhouse Gas Emissions 2023
Emission Factor Source and Update (2024)
Emission calculations are based on Motiva’s official CO₂ emission calculation guidance, complemented by supplier-specific emission factors provided by companies when available. For 2024 reporting, the following approach was applied: For electricity, the supplier-specific CO₂ emission factors reported by companies were used as the primary source.
If such factors were not available, the calculation was based on Finland’s 2023 electricity residual mix.
For other energy, Motiva’s default emission factors were used unless companies reported more specific fuel-based factors.