Facts and figures
Here you will find statistical information about the chemical industry.
Sectoral Overview
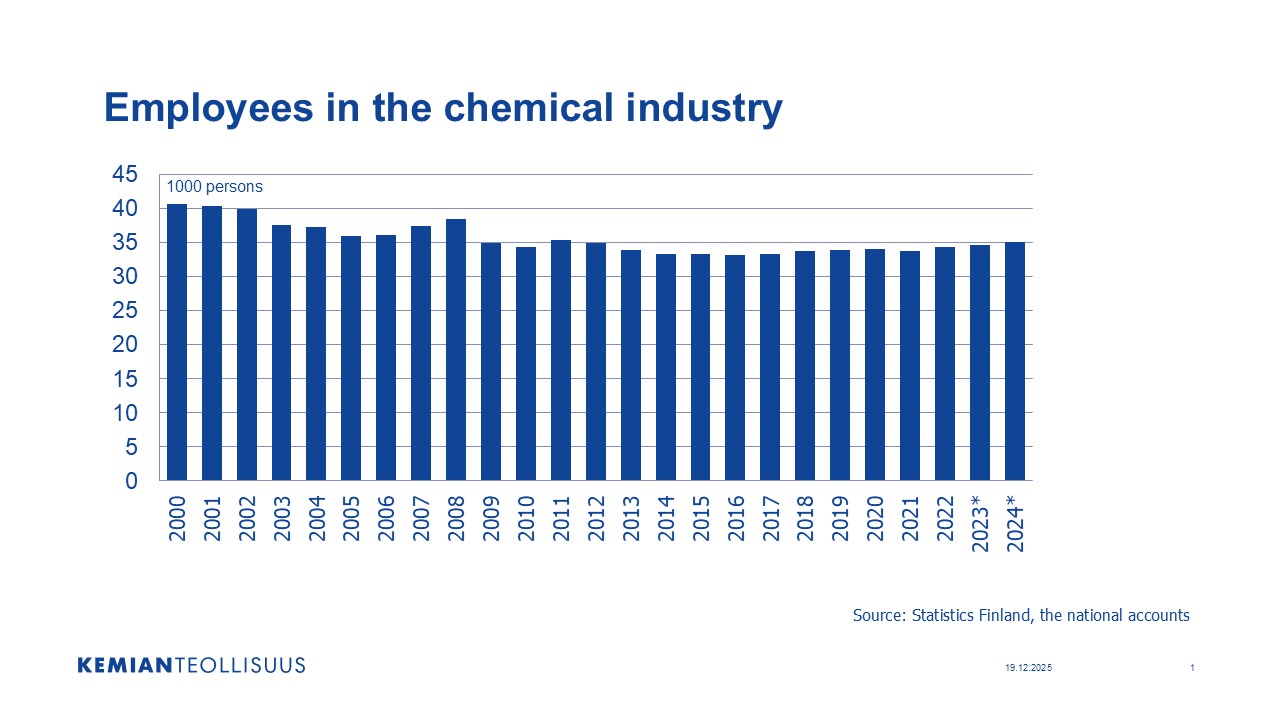
Statistics: The Chemical Industry in Finland
Responsible Care
Climate target
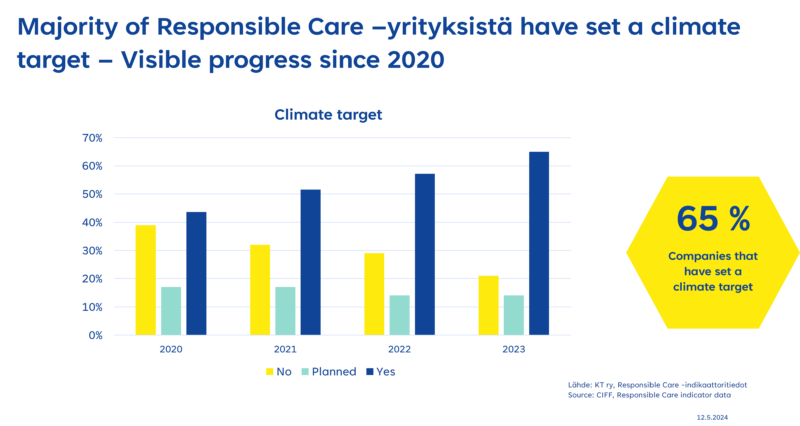
In 2023 65 % of the companies committed to Responsible Care have set their own internal climate target, and 14 % plan to set a target. Questions about climate-related targets and plans have been part of the RC reporting since 2020. So far, there has been clear positive progress in all areas every year.
Definition:
The chemical industry aims to be carbon-neutral on 2045 in Finland. Therefore it is important that the companies in chemical sector set their own sub-targets and plans to achieve carbon neutrality. In the Responsible Care reporting, companies are asked about their climate targets, as well as plans to reduce greenhouse gas emissions from energy use, processes, and raw materials. Differences exist between companies. For example, CO2 emissions from energy production may be significant for one company, while raw material based green house gases may be more relevant for another.
Results:
65% of the companies have set their own internal climate target, and 14 % are planning to set a target in 2023. This is an increase of 8 percentage points from 2021 and 21 percentage points throughout the entire monitoring period since 2020.
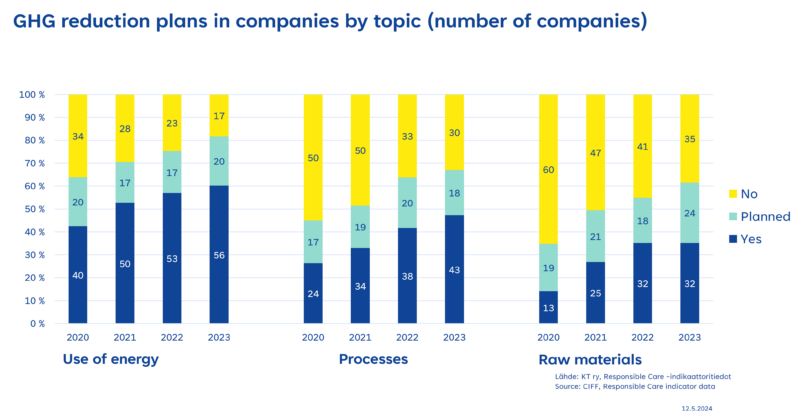
The adoption of climate plans has grown fairly steadily each year. 60 % of the companies (2022: 57 %) have prepared a plan to reduce greenhouse gas emissions from energy production and 22 % are in the process of preparing a plan. 47 % of the companies (2022: 42 %) have prepared a plan to reduce greenhouse gas emissions from production processes, and 22% are in the process of preparing a plan. Similarly, 32 % of the companies (2022: 35 %) have prepared a plan to reduce greenhouse gas emissions from raw materials and 26 % are in the process of preparing a plan.
Biodiversity Target
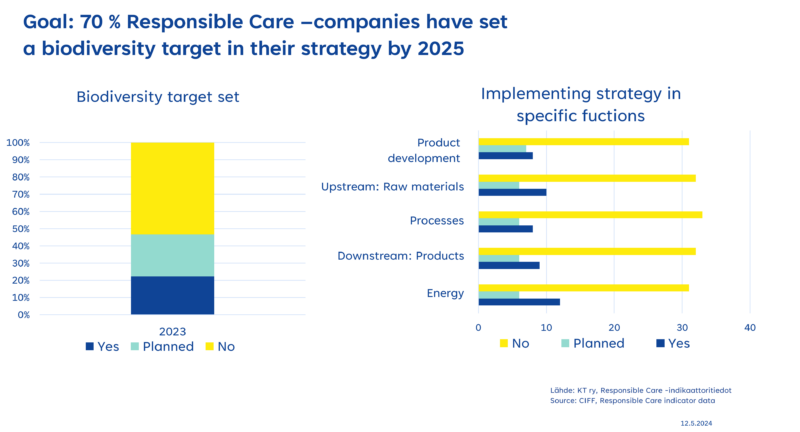
22 % of the companies participating in the Responsible Care program have set a biodiversity-related target in their strategy in 2023, 24% are planning to set one. In addition to climate, 2023 was the first year companies were asked about biodiversity targets as well.
The chemical industry federation has set a long-term goal of nature positivity. A biodiversity roadmap was also set in 2022. The roadmap focuses on the current decade, because like climate action, nature also needs actions now. Our short-term goal is that by 2025 70% of companies in the chemical industry have set a biodiversity-related target in their strategy. The chemical sector is involved in developing international terminology and operating methods, with ISO Standardization for example. We also raise awareness of the subject in various forums and share best practices among member companies within the chemical industry.
As a measure of our intermediate goal, we created a biodiversity indicator for Responsible Care reporting, which measures the number of companies’ biodiversity-related targets in their strategies and the subject areas of related measures. The indicator was developed during 2023, and now with the latest Responsible Care results, we can see for the first time where we are starting from.
Results:
In 2023, 22% of companies have set a biodiversity-related target in their strategy. About 24% of the companies have plans to set a target, while a good half of the companies (53%) do not even have a target planned yet.
When asked in more detail what type of actions have been taken in companies to implement the strategy into operations, the results a varied. Energy-related actions have been carried out slightly more than other actions.

Personnel and Production Volume of Companies Committed to the Program
The Responsible Care program covers approximately 80% of the industry’s production in Finland, as well as 60% of personnel in participating companies.
Definition
The extent of the Responsible Care program is expressed as total amount of production and the number of employees in the participating companies in Finland. Some of the indicator information is proportioned to the amount of production or the number of employees.
Results
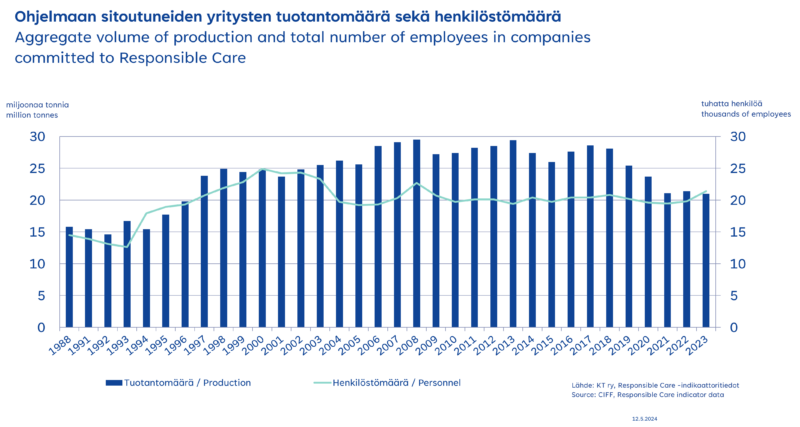
In 2023, total production of the companies committed to the Responsible Care program amounted to 21 million tons and the number of employees to 20 970.
The companies committed to Responsible Care represent 80 % of the production and 60 % of the personnel of the Finnish chemical industry.
The results for 2023 are based on data from 93 companies.
Material Streams in Production
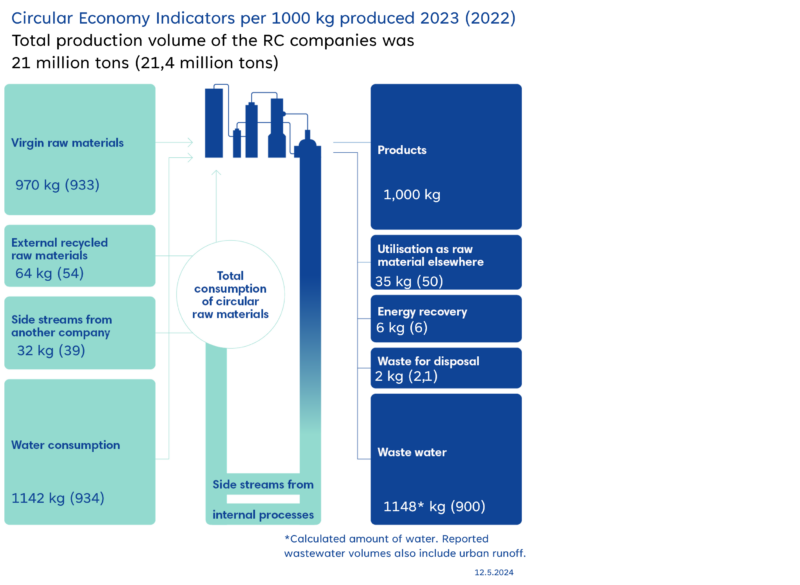
This is an overall picture of the material streams used in the Responsible Care companies. In 2022, 18 percent of the materials used were renewable or recycled.
Roughly 5% of materials leaving the production are by-products and waste materials. 90% of these materials were utilized as material elsewhere or in energy recovery.
The nature of production in the chemical industry varies a lot. In some companies almost all used materials are renewable, while in other companies it is extremely difficult to utilize renewable materials. The proportion of renewable raw materials used in production increased to 13 percent (10), and the number of companies reporting to use renewable materials was 51 percent (47). In addition to renewable materials, we are following closely the use of recycled materials. 53% (53) of companies reported to use recycled materials or side streams.
Water is partly used as a raw material in the production of chemical industry products, and some of it binds into products while some of it leaves the production as wastewater.
This material balance showcases the inputs and outputs of materials per 1,000 kg of products. More and more side streams from internal and external companies are utilised.

Energy Consumption
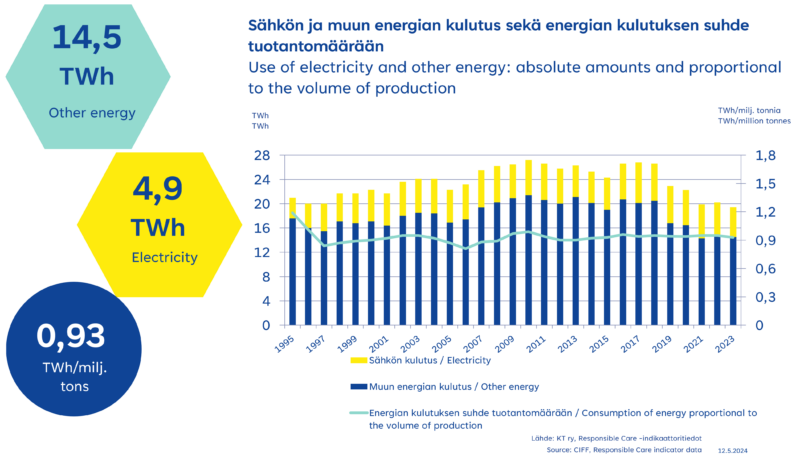
The companies committed to the Responsible Care program have improved their energy efficiency gradually during the past years. In 2023, total amount of energy consumed was 0.93 kWh per one kg of production. The consumption was reduced by 2 percent from 2022. Since 1995, energy consumption per total production volume has decreased by more than 22 percent.
Definition
Energy consumption is reported as consumption of electricity and other energy. Consumption of other energy includes the consumption of fossil fuels such as oil and gas. Companies define the parameters by which they calculate their energy consumption. They also define the extent to which the fuels produced in processes are possibly recoverable as energy. Energy consumption proportional to total production volume signals, among other things, changes in processes and production, as well as improvement in energy efficiency.
Results
In 2023, electricity consumption and the consumption of other forms of energy by the companies committed to the Responsible Care program amounted to 4,9 TWh and 14.5 TWh respectively. In proportion to total production, the consumption of electricity and other forms of energy has decreased 2 percent from 2022.
In 2023, a total of 0.93 kWh energy was consumed per one kg of production. As reference, the corresponding figure in 1995 was 1.2 kWh . Since 1995, energy consumption proportional to total production has decreased by 22 percent.
The majority of consumed electricity is bought from energy producers. In 2023, bought electricity accounted for around 96 percent of total electricity consumption, whereas approximately 17 percent of bought energy consisted of other forms of energy. In many cases, energy created at sites was also sold to outside parties.
In 2023, a total of 19 percent of consumed energy was produced by using renewable energy sources. 47 percent of all electricity consumed and 9 percent of all other types of energy was produced by using renewable energy sources.
Finland’s total energy and electricity consumption amounted to some 366 TWh in 2023. The amount was 1,7 percent more than in 2022. The total electricity consumption was 79,77 TWh. Approximately 37,8 percent of the total energy consumption was made using renewable energy sources. *)
*) Source: Statistics Finland
https://pxdata.stat.fi/PXWeb/pxweb/fi/StatFin/StatFin__ehk/?tablelist=true
Water Consumption
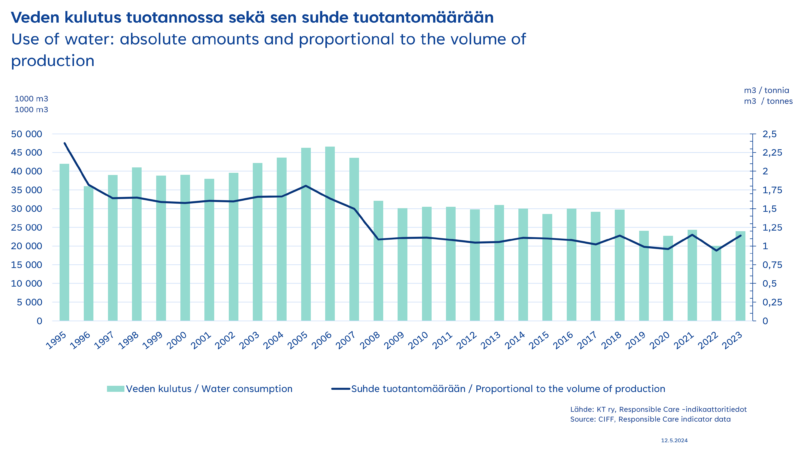
In 2023, the companies committed to Responsible Care consumed 1.14 litres surface or ground water per one kg of production. Water consumption in production has significantly improved. Consumption per kilogram of production has decreased by 52 percent since 1995.
Definition
The water consumed in production is included in products or is discharged with wastewater for purification. Water consumption compared to total production signals resource efficiency. Water that companies use for cooling purposes is excluded. The water taken in flows in the cooling pipes separate from the materials used in the processes, after which the water is returned back to the sea or lake.
Results
The companies committed to Responsible Care consumed altogether around 23.96 million m3 of water. The use increased by 21%, from 2022.
A total of 1.14 litres of surface or ground water per kg of production was used by companies committed to Responsible Care program In 2023. Part of this water was included in products and part of it was discharged with wastewater for purification. As a reference the corresponding figure in 1995 was 2.4 litres surface or ground water per one kg of production. Water consumption has decreased by 52% since 1995.
90% of consumed water is originated from surface water sources and rest is consumed from groundwater sources.
Consumption of Cooling Water and Other Water
Definition
Water consumption is divided into the consumption of cooling water and consumption of water in production. Cooling water is sea- or lake water, taken in for cooling purposes. The water taken flows in the cooling pipes separate from the materials used in the processes, after which the water is returned back to the sea or lake. The water consumed in production is absorbed in the products or exited as wastewater for purification.
Results
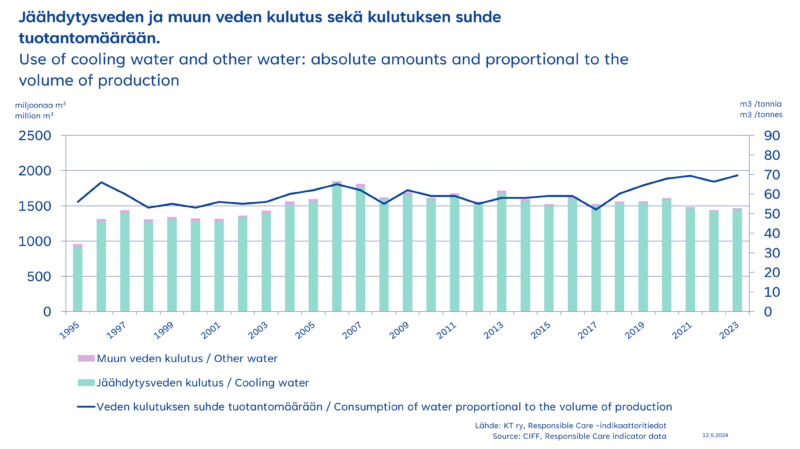
In 2023, the consumption of cooling water decreased by around 1 % and water used in production increased by 20 % compared to the previous year.
In the companies committed to the Responsible Care program, cooling water represents about 99 % of total water consumption. Approximately 86 % of cooling water is originated from the sea, rest is from other surface water sources. 90 % of water used in production is originated from surface water sources and rest is consumed from groundwater sources.
In 2023, a total of 1.14 liters surface or ground water per one kg of production was used. Part of this water was included in in the products and part of it was discharged with wastewater for purification. As reference the corresponding figure at 1995 was 2.4 liters surface or ground water per kilogram of production.
Air Emissions
Air Emissions
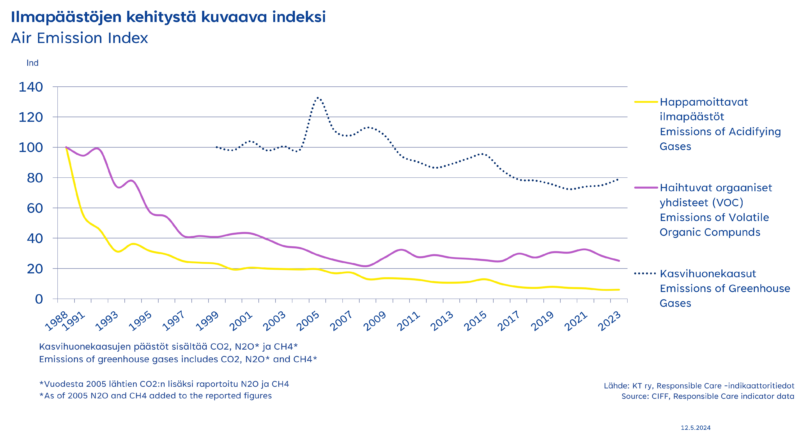
Emissions to air have steadily decreased in chemical industry. The companies committed to Responsible Care program have reduced their emissions of acidifying gases by 94 percent since 1988. Reduction in the emissions of volatile organic compounds has been 72 percent at the same time. Direct emissions of the greenhouse gases have decreased by 31 percent since 1999.
Definition
The air emission index is a sum of volatile organic compounds (VOC) and of air emissions with acidifying potential and global warming potential proportional to the volume of production. The base year of the index is 1988, apart from emissions with global warming potential, for which the base year is 1999. The environmental impact of different types of emissions have been quantified by multiplying the emission with a unique weight factor, which describes the environmental impact of the emission in terms of a reference chemical.
Emissions with acidifying potential include sulphur compound emissions (reported as SO2 and changed to SO2 by multiplying with a unique weight factor of 1.00), nitrogen compound emissions (reported as NO2 and changed to SO2 by multiplying with a unique weight factor of 0.41) and ammonium emissions (reported as NH3 and changed to SO2 by multiplying with a unique weight factor of 1.3).
Emissions with global warming potential include carbon dioxide emissions (reported as CO2 and changed to CO2 by multiplying with a unique weight factor of 1.00), methane emissions (reported as CH4 and changed to CO2 by multiplying with a unique weight factor of 21) and nitrous oxide emissions (reported as N2O and changed to CO2 by multiplying with a unique weight factor of 310). VOC emissions are reported as total VOC.
Results
Air emissions with acidifying potential by the companies committed to the Responsible Care programme have decreased by 94 percent since 1988. This shows that the companies’ emission limitation efforts have been successful. Similar development can be seen in VOC emissions, which have decreased by 72 percent since 1988.
Emissions with global warming potential (greenhouse gases) have been monitored in the chemical industry on a sectoral basis since 1999. This is the base year of the index for these emissions. The results show that direct greenhouse gas emission have decreased by 21 percent since 1999. In the same time, direct and indirect greenhouse gas emissions have decreased by 31 percent since 1999. Direct greenhouse gas emissions are CO2, CH4 and N20 emissions from production processes and on-site-energy-production, while indirect emissions include the emissions from the production of bought electricity and energy.
Release of Sulphur Compounds to Air
Definition
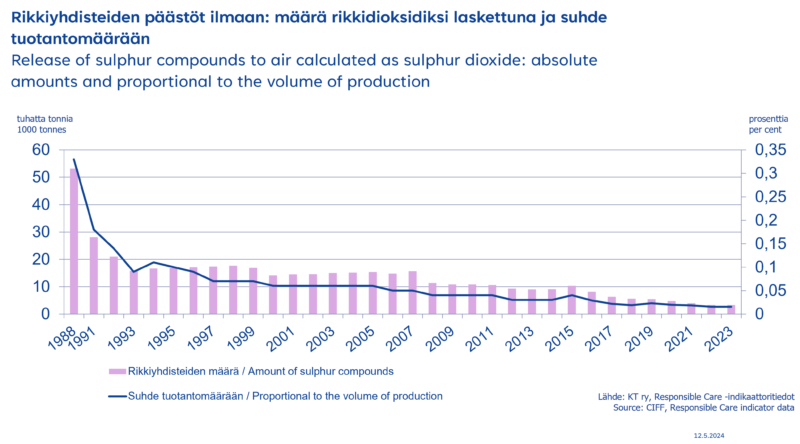
Sulphur compound emissions include emissions from on-site power and steam generation and are reported and calculated as sulphur dioxide (SO2). In the air, sulphur dioxide contributes to environmental acidification, which in turn damages vegetation and causes corrosion damages.
Results
In 2023, sulphur dioxide emissions by the companies committed to the Responsible Care program totaled some 3 300 tons, down 1,5 % from 2022. Proportional to total production volume, sulphur dioxide emissions remained at 2022 level. Since 1988, sulphur dioxide emissions to air have decreased by more than 95%.
Release of Volatile Organic Compounds (VOC) to Air
Definition
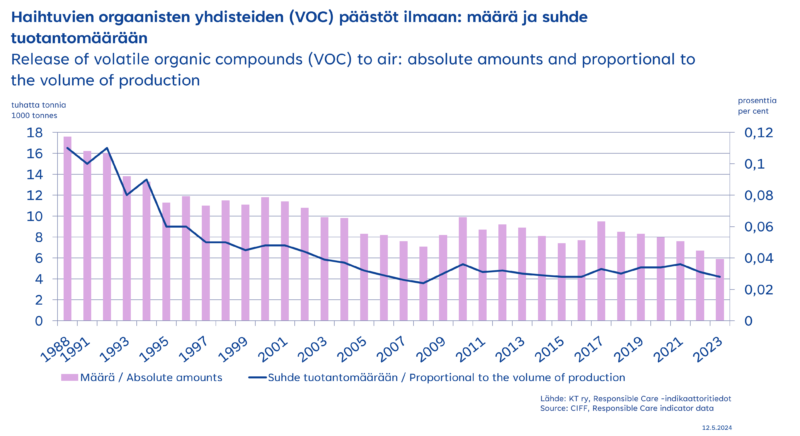
Volatile organic compounds (VOC) are organic compounds with a vapor pressure of at least 0.01 kPa at 20°C or having a corresponding volatility under particular conditions of use. The amount is reported as a sum of different hydrocarbons. VOCs increase the formation of ozone in the lowest layers of the atmosphere. Increased ozone concentrations contribute to respiratory diseases and affect vegetation.
Results
In 2023, VOC emissions by the companies committed to the Responsible Care program totaled some 5 900 tons, down about 12 % from 2022. Proportional to total production volume, VOC emissions amounted to some 0.03 %. Since 1988, VOC emissions proportionated to total production volume have decreased by about 75 %.
Release of Nitrogen Compounds to Air
Definition
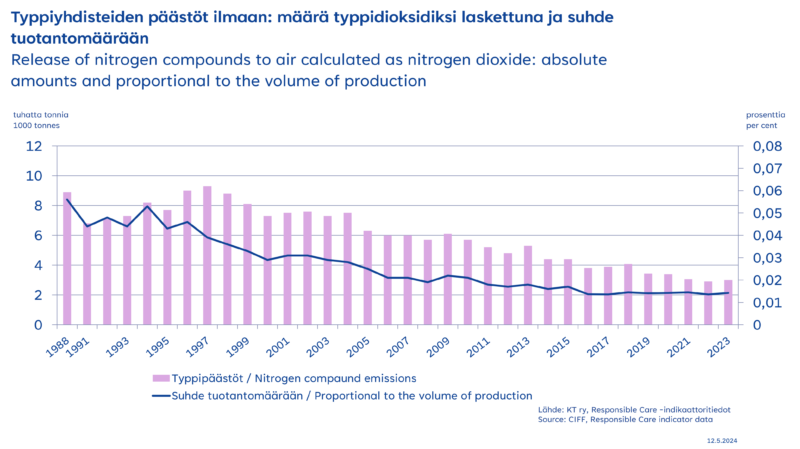
Nitrogen compound emissions to air include emissions from on-site power and steam generation and are reported and calculated as nitrogen dioxide (NO2). In the air, nitrogen dioxide contributes to environmental acidification and increases eutrophication of water bodies.
Results
In 2023, nitrogen compound emissions by the companies committed to the Responsible Care program totaled some 3 tons, 3 % more than previous year. Proportional to the volume of production, nitrogen compound emissions increased by 5 %, compared to the previous year. The nitrogen compound emissions in proportion to the volume of production have decreased by 75 % since 1988.
Discharges to Water
Discharges to Water
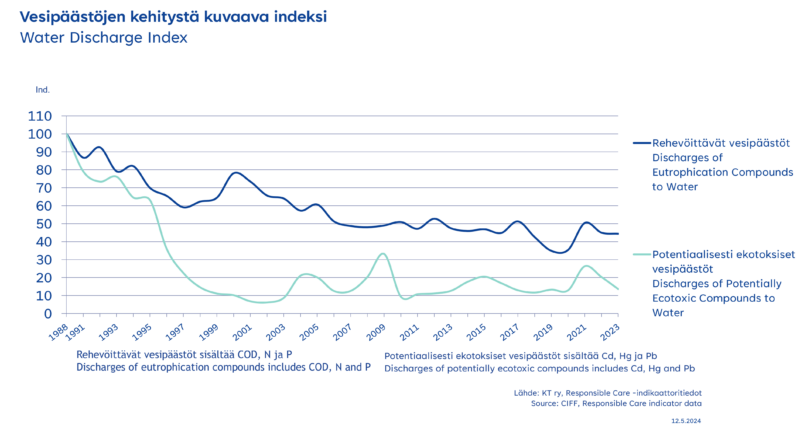
Discharges to water in chemical industry decreased significantly during 1990s. Reduction in water discharges with eutrophication potential has been 55% and in potentially ecotoxic water discharges 86%.
Definition
The water discharge index includes water discharges with eutrophication potential and potentially ecotoxic water discharges, both proportionated to the volume of production. The base year of the index is 1988. The environmental impact of different types of emissions have been quantified by multiplying the emission with a unique weight factor, which describes the environmental impact of the emission in terms of a reference chemical.
Discharges with eutrophication potential include discharges of phosphorus (changed to PO4 by multiplying with a unique weight factor of 3.06), nitrogen (changed to PO4 by multiplying with a unique weight factor of 0.42) and COD (Chemical Oxygen Demand) (changed to PO4 by multiplying with a unique weight factor of 0.022).
Potentially ecotoxic discharges include the discharges of mercury (changed to 1,4-Dichlorobenzene with a unique weight factor of 316.97), cadmium (changed to 1,4-Dichlorobenzene with a unique weight factor of 289.43) and lead (changed to 1,4-Dichlorobenzene with a unique weight factor of 2.4).
Results
Since 1988, the companies committed to the Responsible Care programme have succeeded in reducing their water discharges with eutrophication potential by 55%. In 2023 the water discharges with eutrophication potential decreased by approximately 1% compared to 2022.
At their present level, discharges with eutrophication potential by the chemical industry as a whole are not significant in Finnish terms. The companies’ discharge reduction efforts have been beneficial throughout the review period, and in general the trend is downwards.
Similar and even more effective progress has been made in reducing potentially ecotoxic water discharges, which have decreased by 86% since 1988. In 2022 the amount of ecotoxic water discharges decreased by 33% compared to the previous year.
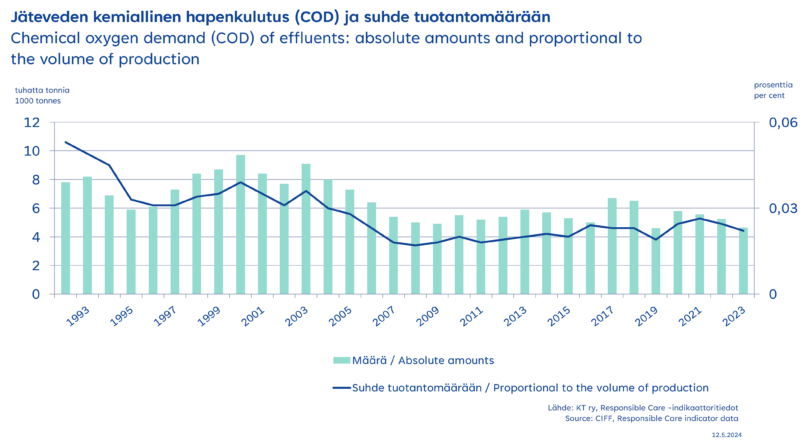
Chemical Oxygen Demand
Definition
The chemical oxygen demand (COD) is the amount of oxygen required to degrade the organic compounds of wastewater. The higher the COD concentration of wastewater, the more oxygen the discharges demand from water bodies.
In the Responsible Care program, wastewater effluents by the chemical industry have been measured and calculated from the wastewater led from plants directly to receiving waters or to community sewerage systems. This enables monitoring the impact on effluents by the companies’ own measures and the results being unaffected by the performance of municipal sewage treatment plants. Waste waters going through the sewerage system are treated by community wastewater treatment plants before being discharged into receiving waters, thereby substantially reducing the impact on water bodies.
Results
In 2023, wastewater COD concentration for the companies committed to the Responsible Care program was about 4 700 tons, which decreased 11 % from 2022. Proportional to production volume, the COD value has decreased by some 10 % from 2022. Since 1992 the chemical oxygen demand in proportion to the volume of production has diminished by 58 %.
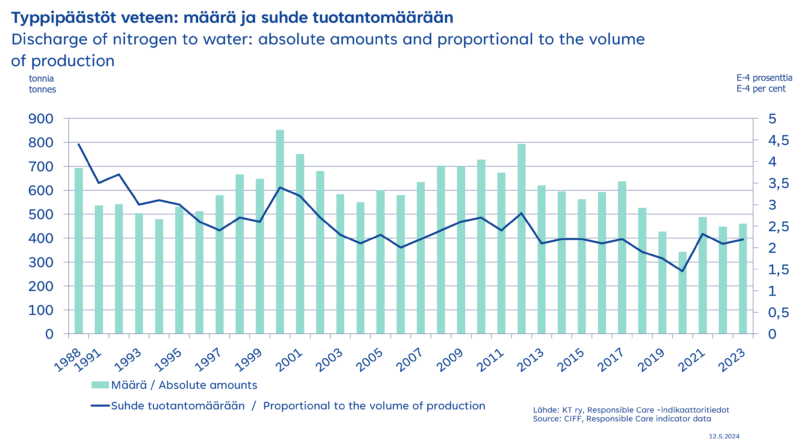
Discharge of Nitrogen to Water
Definition
Discharges of nitrogen compounds are measured as elemental nitrogen (N). Discharges of nitrogen compounds show in increased eutrophication and turbidness of waters and in algal growth.
In the Responsible Care programme, wastewater effluents by the chemical industry have been measured and calculated from the wastewater led from the plants directly to receiving waters or to community sewerage systems. This enables monitoring impact on effluents by the companies’ own measures and the results being unaffected by the performance of municipal sewage treatment plants. Waste waters going through the sewerage system are treated by community wastewater treatment plants before being discharged into receiving waters, thereby substantially reducing the impact on water bodies.
Results
In 2023, total nitrogen discharges by the companies committed to the Responsible Care program amounted to around 460 tons, which was decreased by around 3 % from 2022. In proportion to total production volume, nitrogen discharges have decreased by about 5 % since 2022. Since 1988 the nitrogen discharges in proportion to the volume of production have decreased by 50 %.
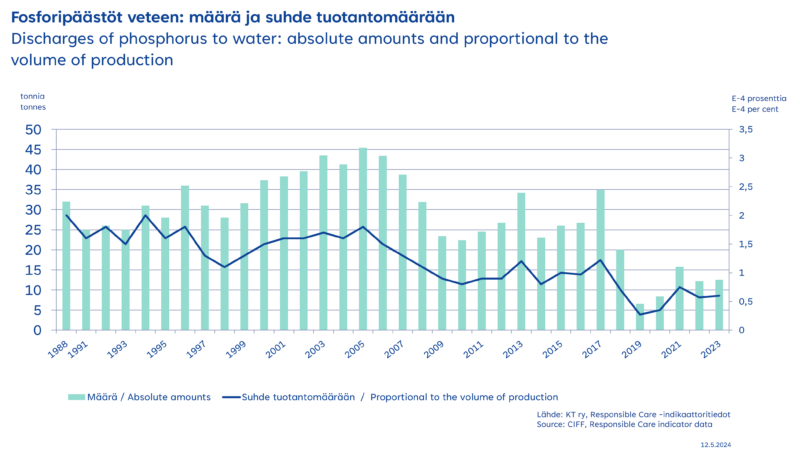
Discharge of Phosphorus to Water
Definition
Discharges of phosphorus compounds are measured and calculated as elemental phosphorus (P). Discharges of phosphorus compounds show in increased eutrophication and turbidness of waters as well as in algal growth.
In the Responsible Care program, wastewater effluents by the chemical industry have been measured and calculated from the wastewater led from plants directly to receiving waters or to community sewerage systems. This enables monitoring the impact on effluents by the companies’ own measures and the results being unaffected by the performance of municipal sewage treatment plants. Waste waters going through the sewerage system are treated by community wastewater treatment plants before being discharged into receiving waters, thereby substantially reducing the impact on water bodies.
Results
In 2023, phosphorus discharges by the companies committed to the Responsible Care program totaled 12,5 tons, which increased of 3 % from 2022. In proportion to the volume of production, phosphorus discharges increased 5 % from 2022. Since 1988 phosphorus discharges in proportion to the volume of production have decreased by 70%.
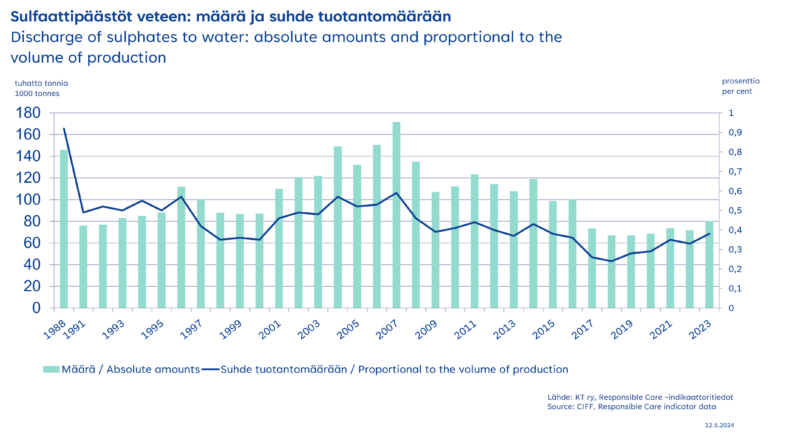
Discharge of Sulphates to Water
Definition
Discharges of sulphur compounds are measured and calculated as sulphate (SO42-), because most of the sulphur compounds ending up in water bodies are explicitly sulphates. High sulphate concentrations can damage the fish population and other aquatic organisms.
In the Responsible Care programme, wastewater effluents by the chemical industry have been measured and calculated from the wastewater led from plants directly to receiving waters or to community sewerage systems. This enables monitoring the impact on effluents by the companies’ own measures and the results being unaffected by the performance of municipal sewage treatment plants. Waste waters going through the sewerage system are treated by community wastewater treatment plants before being discharged into receiving waters, thereby substantially reducing the impact on water bodies.
Results
In 2023, sulphate discharges to water by the companies committed to the Responsible Care program totaled about 81,000 tonnes, which increased 12 % from 2022. Since 1988, the amount of sulphate discharges in proportion to the volume of production has decreased by about 59 %.
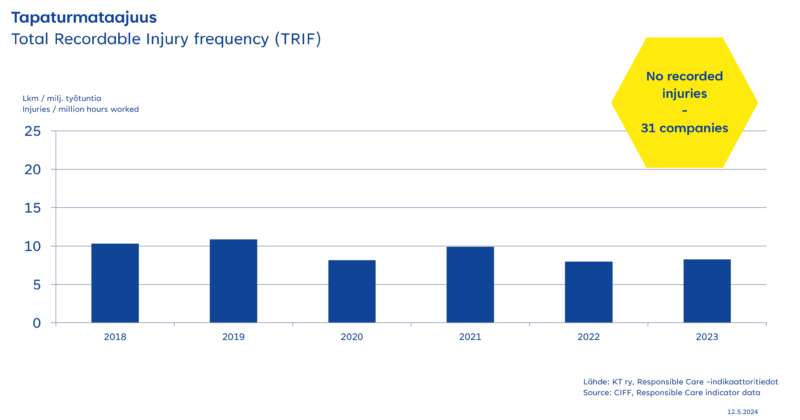
Total Recordable Injury frequency (TRIF)
Definition
Injury is an occupational injury which requires medical treatment. Not included are sick leaves, fatalities or accidents occurred when commuting between home and work. The frequency rate is expressed as the number of injuries per million working hours. Employee refers to all company employees excluding the personnel of outside contractors.
Total Recordable Injury Frequency (TRIF)
In 2023, a total of 8,24 injuries per million hours worked (TRIF) occurred in the companies committed to the Responsible Care programme. Lost time injuries frequency rate increased by 4 % since 2022.
31 companies reported zero injuries in 2023.
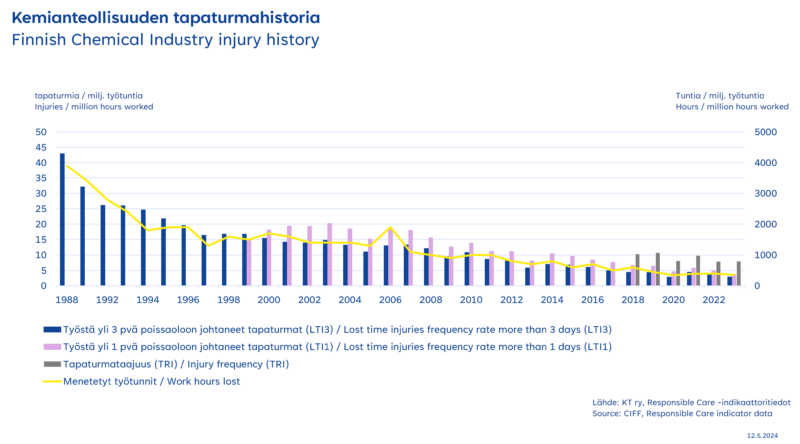
Finnish Chemical Industry Injury History
ocusing on occupational safety has produced long-term results in the chemical industry.
The results
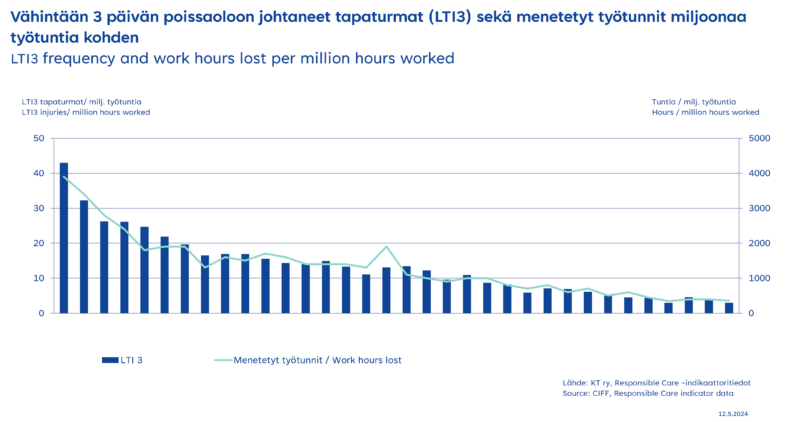
Companies participating in the Responsible Care program had 3.1 LTI3 accidents per million work hours in 2023. The number of lost work hours was 358 per million work hours. The frequency of LTI3 accidents decreased by 16% from the previous year. In 2022 the frequency was 3.7 LTI3 accidents per million working hours. Since the comparison year of 1988, the LTI3 frequency has decreased by 93%.
The number of lost working hours decreased by 9% compared to the previous year.
There were 3.7 accidents causing at least one day of absence per million working hours (LTI1). This indicator decreased by 25% from 2022.
In 42% of the companies, there were no lost time injuries for personnel.
Only the company’s own personnel, not contractors, have been taken into account in the figures.
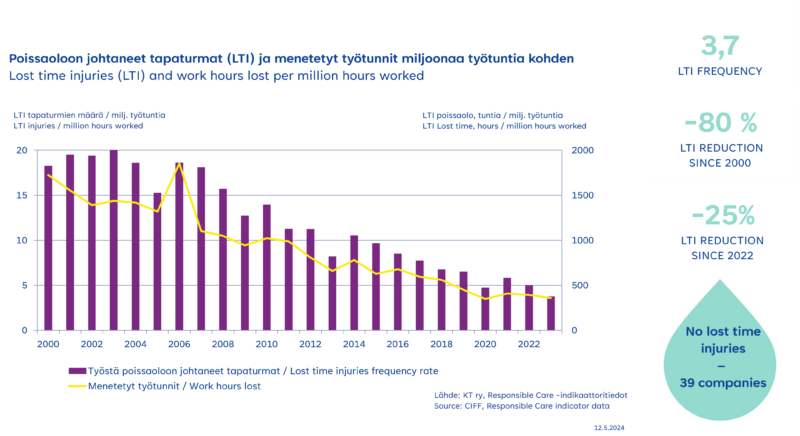
Lost Time Injuries (LTI) and Work Hours Lost per Million Hours Worked
Definition
Lost time injury (LTI) is an occupational injury to an employee resulting in at least one day absence from work in addition to the day of accident. Not included are sick leaves, fatalities or accidents occurred when commuting between home and work. The frequency rate is expressed as the number of injuries per million working hours. Employee refers to all company employees excluding the personnel of outside contractors.
Results
In 2023, a total of 3,7 lost time injuries per million hours worked (LTI1) occurred in the companies committed to the Responsible Care program. Lost time injuries frequency (LTIF) decreased by 25 % since 2022.
Since 2000 the lost time injuries have decreased 80 %.
42 % of the companies committed to the Responsible Care programe reported zero lost time injuries for employees.
LTI3 Frequency
The continuous improvement of health and safety issues has produced results in the chemical industry. In 2023, a total of 3.1 lost time injuries per million man-hours worked (LTI3) occurred in the companies committed to the Responsible Care program. Lost time injuries frequency rate decreased by 15 % from 2022. Since 1988 LTI3 injuries have decreased by 93 %.
Definition
LTI3 Lost time injury is an occupational injury to an employee resulting in at least three days’ absence from work in addition to the day of accident. Not included are sick leaves, fatalities or accidents occurred when commuting between home and work. The frequency is expressed as the number of injuries per million working hours. Employee refers to all company employees excluding the personnel of outside contractors.
Work hours lost refer to the amount of work hours lost due to injuries defined above, not including those due to fatalities or invalidity. Lost time injury frequency rate measures the level of occupational safety of a company and forecasts the likelihood of occurrence of actual process accidents. The number of work hours lost gives an indication of the severity of injuries.
Results
In 2023, a total of 3,1 lost time injuries per million hours worked (LTI3) occurred in the companies committed to the Responsible Care program. The number of work hours lost was 358 hours per million hours worked. LTI3 frequency has decreased by 18 % from 2022 when the total was 3,7 lost time injuries per million hours worked. Since 1988 LTI3 frequency has reduced by 93 %.
The number of work hours lost per million hours worked decreased 10% compared to the previous year.
Injury to an employee resulting in at least one day’s absence from work is a more sensitive indicator. The progress with this indicator has been similar to LTI3. In 2023, a total of 3,7 LTI1 injuries per million hours worked occurred in the companies committed to the Responsible Care program. LTI1 decreased by 10 % from 2022.
42 % of the companies committed to the Responsible Care program reported zero lost time injuries for employees.
Only the company’s own personnel, not contractors, have been taken into account in the figures.
Near Miss Reporting and Safety Observations
Definition
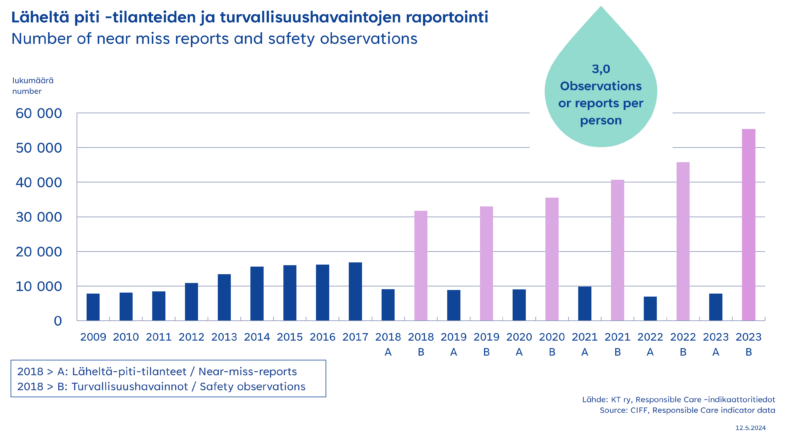
Near miss reporting and safety observations reporting was developed in 2018. Companies were asked for separate reporting on both near miss situations as well as general safety observations. Since 2018, a more comprehensive picture was seen on the development in the safety culture with a preventive approach.
Near miss reporting
Near miss reporting is a system which collects and evaluates data on potentially hazardous injuries and damages. Corrective actions are evaluated and implemented based on near miss reporting. Near miss reporting is an effective way of preventing injuries and damages.
Safety observations
Number of reported safety observations. Safety observations are observations in lack of physical environment or ways of doing, that might increase the risk for a work safety or process safety incident. Reported observations can also be positive observations for good conduct in physical environments or ways of doing.
Results
Near miss reporting and safety observations resulted in 63 176 (52 716 previous year) reports in total. This means 3 reports or observations per person.
99% of companies committed to the Responsible Care program reported a total of 7825 near miss reports and 55 351 safety observations in 2023.
Personnel and Production Volume of Companies Committed to the Program
The Responsible Care program covers approximately 80% of the industry’s production in Finland, as well as 60% of personnel in participating companies.
Definition
The extent of the Responsible Care program is expressed as total amount of production and the number of employees in the participating companies in Finland. Some of the indicator information is proportioned to the amount of production or the number of employees.
Results
In 2023, total production of the companies committed to the Responsible Care program amounted to 21 million tons and the number of employees to 20 970.
The companies committed to Responsible Care represent 80 % of the production and 60 % of the personnel of the Finnish chemical industry.
The results for 2023 are based on data from 93 companies.

Climate Target
In 2023 65 % of the companies committed to Responsible Care have set their own internal climate target, and 14 % plan to set a target. Questions about climate-related targets and plans have been part of the RC reporting since 2020. So far, there has been clear positive progress in all areas every year.
Definition:
The chemical industry aims to be carbon-neutral on 2045 in Finland. Therefore it is important that the companies in chemical sector set their own sub-targets and plans to achieve carbon neutrality. In the Responsible Care reporting, companies are asked about their climate targets, as well as plans to reduce greenhouse gas emissions from energy use, processes, and raw materials. Differences exist between companies. For example, CO2 emissions from energy production may be significant for one company, while raw material based green house gases may be more relevant for another.
Results:
65% of the companies have set their own internal climate target, and 14 % are planning to set a target in 2023. This is an increase of 8 percentage points from 2021 and 21 percentage points throughout the entire monitoring period since 2020.
The adoption of climate plans has grown fairly steadily each year. 60 % of the companies (2022: 57 %) have prepared a plan to reduce greenhouse gas emissions from energy production and 22 % are in the process of preparing a plan. 47 % of the companies (2022: 42 %) have prepared a plan to reduce greenhouse gas emissions from production processes, and 22% are in the process of preparing a plan. Similarly, 32 % of the companies (2022: 35 %) have prepared a plan to reduce greenhouse gas emissions from raw materials and 26 % are in the process of preparing a plan.
Energy Consumption
The companies committed to the Responsible Care program have improved their energy efficiency gradually during the past years. In 2023, total amount of energy consumed was 0.93 kWh per one kg of production. The consumption was reduced by 2 percent from 2022. Since 1995, energy consumption per total production volume has decreased by more than 22 percent.
Definition
Energy consumption is reported as consumption of electricity and other energy. Consumption of other energy includes the consumption of fossil fuels such as oil and gas. Companies define the parameters by which they calculate their energy consumption. They also define the extent to which the fuels produced in processes are possibly recoverable as energy. Energy consumption proportional to total production volume signals, among other things, changes in processes and production, as well as improvement in energy efficiency.
Results
In 2023, electricity consumption and the consumption of other forms of energy by the companies committed to the Responsible Care program amounted to 4,9 TWh and 14.5 TWh respectively. In proportion to total production, the consumption of electricity and other forms of energy has decreased 2 percent from 2022.
In 2023, a total of 0.93 kWh energy was consumed per one kg of production. As reference, the corresponding figure in 1995 was 1.2 kWh per kilogram of production. Since 1995, energy consumption proportional to total production has decreased by 22 percent.
The majority of consumed electricity is bought from energy producers. In 2023, bought electricity accounted for around 96 percent of total electricity consumption, whereas approximately 17 % of bought energy consisted of other forms of energy. In many cases, energy created at sites was also sold to outside parties.
In 2023, a total of 19 percent of consumed energy was produced by using renewable energy sources. 47 percent of all electricity consumed and 9 percent of all other types of energy was produced by using renewable energy sources.
Finland’s total energy and electricity consumption amounted to some 366 TWh in 2023. The amount was 1,7 percent more than in 2022. The total electricity consumption was 79,77 TWh. Approximately 37,8 percent of the total energy consumption was made using renewable energy sources. *)
*) Source: Statistics Finland
https://pxdata.stat.fi/PXWeb/pxweb/fi/StatFin/StatFin__ehk/?tablelist=true
Greenhouse Gases
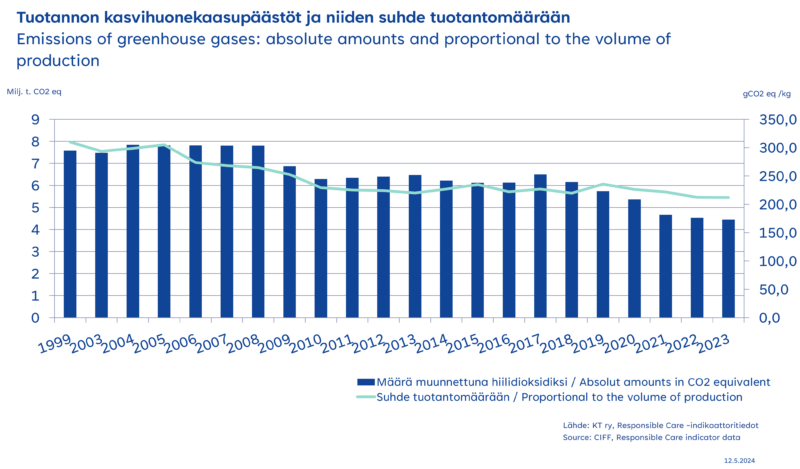
In 2023, greenhouse gas intensity of production by companies committed to Responsible Care was around 212 gCO2e per one kg of production. In 1999 it was 310 g CO2e per one kg of production. The companies committed to Responsible Care programme have reduced the greenhouse gas emissions by 31% during monitoring.
Definition
Emissions of greenhouse gases include not only actual process emissions, but also emissions from on-site power and steam generation. Additionally, indirect greenhouse gas emissions from the production of bought energy are calculated. Greenhouse gases affect global warming, and it is a global objective to reduce these emissions.
Other greenhouse gases than carbon dioxide are methane CH4, nitrous oxide emissions N20 and the fluorinated greenhouse gas HFC. In the greenhouse gas emission calculations methane and nitrous oxide emissions are converted to carbon dioxide equivalent kilos with the factors: for methane reported as CO2 and changed to CO2 by multiplying with a unique weight factor of 21 and for nitrous oxide reported as CO2 and changed to CO2 by multiplying with a unique weight factor of 310.
Results
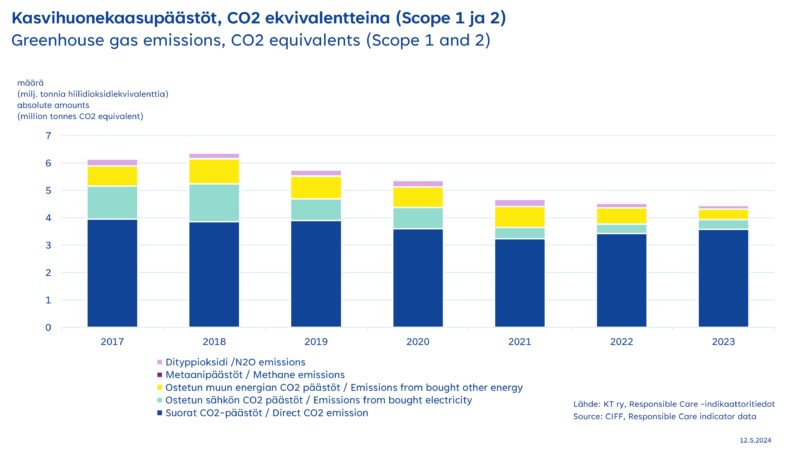
In 2023, direct and indirect carbon dioxide emissions by the companies committed to the Responsible Care programme were some 4.45 million tonnes. The emissions are down 2 % from 2022. Compared to the volume of production, emissions decreased by 1 %.
83% of the total amount is direct greenhouse gas emissions from processes, while the remaining 17 % is indirect greenhouse gas emissions from purchased energy production. Behind the long-term decrease in the greenhouse gas emissions is the development of both the energy sector, as well as production facilities towards low-emission processes. 45 % (2022: 38%) of the purchased energy was made from renewable sources in 2023.
The direct carbon dioxide generated by the companies committed to Responsible Care were 3.6 million tons in 2023. (2022: 3.4 million tons). Increase from 2022 was approximately 4%.
Other greenhouse gas emissions besides carbon dioxide were around 557 tons (2022: 620) (Methane CH4 114 tons and nitrous oxide N2O 443 tons). The emissions from other greenhouse gases than carbon dioxide, when calculated as CO2 equivalents, were a total of 0.14 million tons. This decreased 20% from 2022 levels.
In 2023, greenhouse gas intensity of production of companies committed to Responsible Care was around 212 gCO2e per one kg of production, down 1 % from 2022. This figure includes direct greenhouse gas emissions from production and on-site energy production and indirect fossil greenhouse gas emissions from purchased electricity and energy production. In year 1999 the number was 310 gCO2e per one kg of production.
The biggest source of greenhouse gas emissions in Finland is the energy sector. The total carbon dioxide emissions in Finland were 50,1 million tons in 2022. *)
*) Statistics Finland